The Detail View
Upon selecting an instance from the dashboard, you will find yourself in a detailed view of what that machine was doing. The view contains a timeline as well as as drill-down visualisations at the bottom.
The Timeline
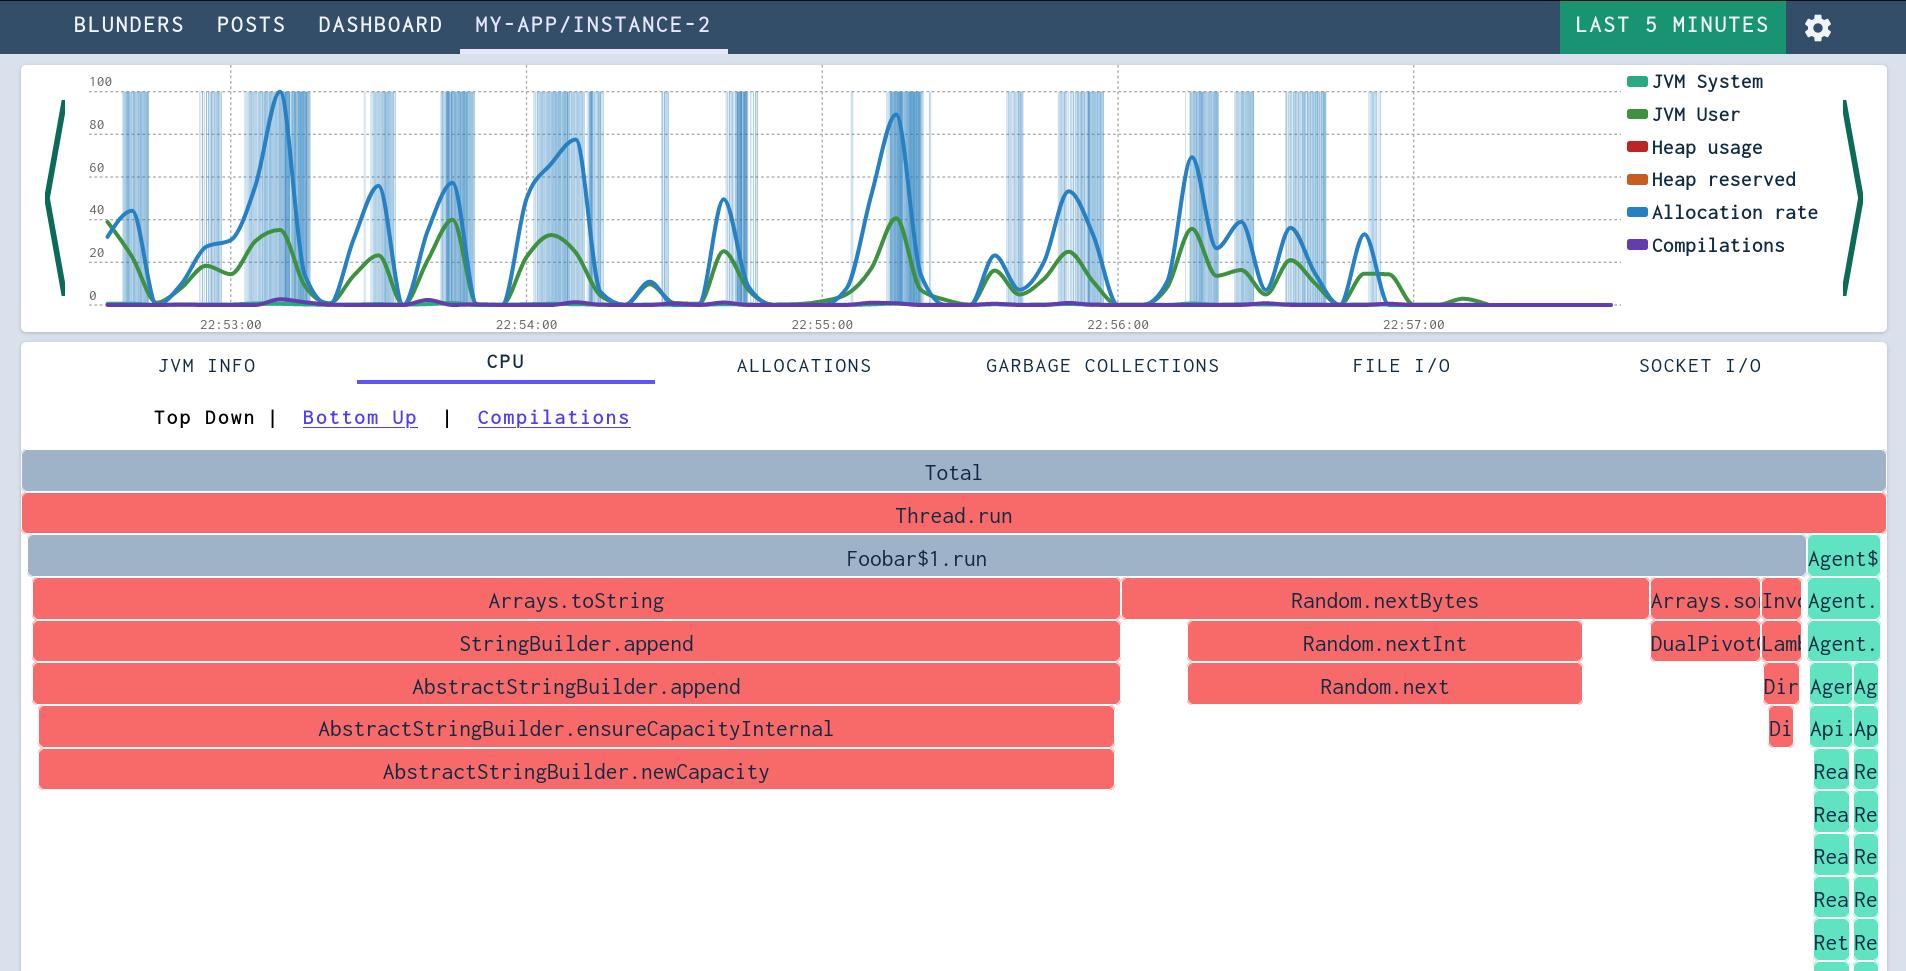
The timeline chart provides an overview of the most significant metrics and events for understanding the performance patterns of a Java Application.
There are 6 lines charted in the Graph.
- JVM System CPU - is the CPU usage of the JVM, excluding your application code. This is usually very, very low.
- JVM User CPU - is the CPU usage of your application code. If this maxes out, it likely means that your application is CPU-bound and that you should focus on reducing CPU usage.
- Heap Usage - This is how much of the JVM Heap the application is using. The heap is the part of memory where objects get allocated.
- Heap reserved - This is the current size of the heap. This might vary if the JVM allocates more memory from the operating system.
- Allocation rate - How much memory your application is allocating per second. This more memory allocated, the more the Garbage Collector needs to work.
- Compilations The Java Virtual Machine utilizes Just In Time (JIT) compilation - meaning that code is compiled from byte code to native CPU instructions on demand. Code may also be re-compiled with higher levels of optimization.
In addition to these lines, Garbage Collections are also shown in the timeline as blocks in the background. The width of the block indicates the length of the Garbage Collection. The colour indicates the type of Garbage Collection.
If there are a lot of Garbage Collections, you probably need to take a look at your allocation rate - high allocation rates and lots of Garbage Collections often go hand in hand.
We will take a look at how to dig down into the detail views in the upcoming pages.