The Dashboard
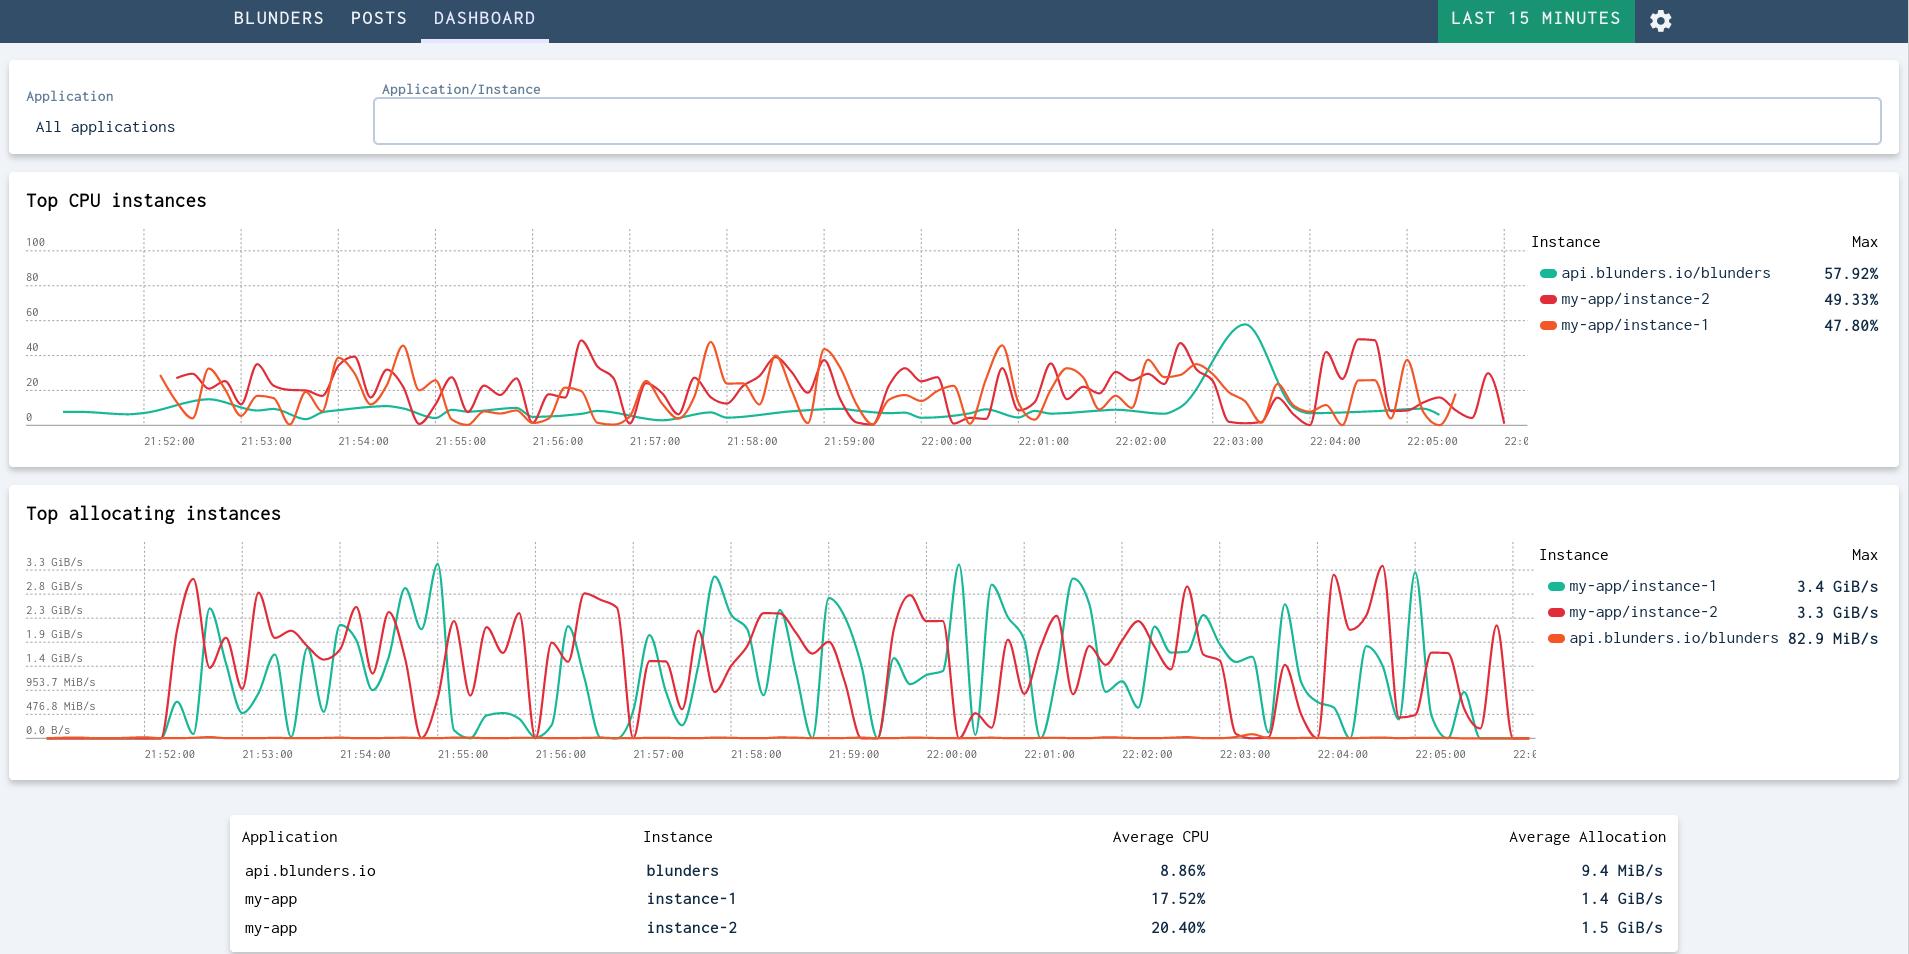
The dashboard is the main entrypoint to understanding the performance of your applications. It contains an overview of the applications attached to Blunders - how much CPU they use and how much memory they allocate.
The Time Selector
The time selector follows you around in Blunders. It's located in the navigation bar, in the top right. It is available both in the dashboard and in detail views.
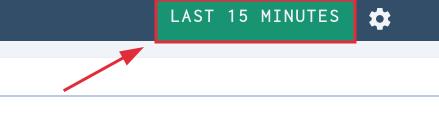
The time selector can be used to select both hours relative to now, as well as allowing you to select an absolute timespan to view. The timespan follows is also applied if you navigate to detail views.
Selecting Applications and Instances
Blunders has the concept of applications and instances. The top of the dashboard is used to filter which of these applications and instances should be shown.
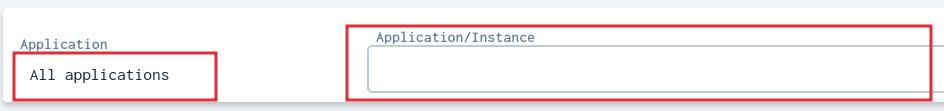
You can both select which application you want to see using the drop-down, or search for the application or instance using the search box. The selection will affect the entire dashboard.
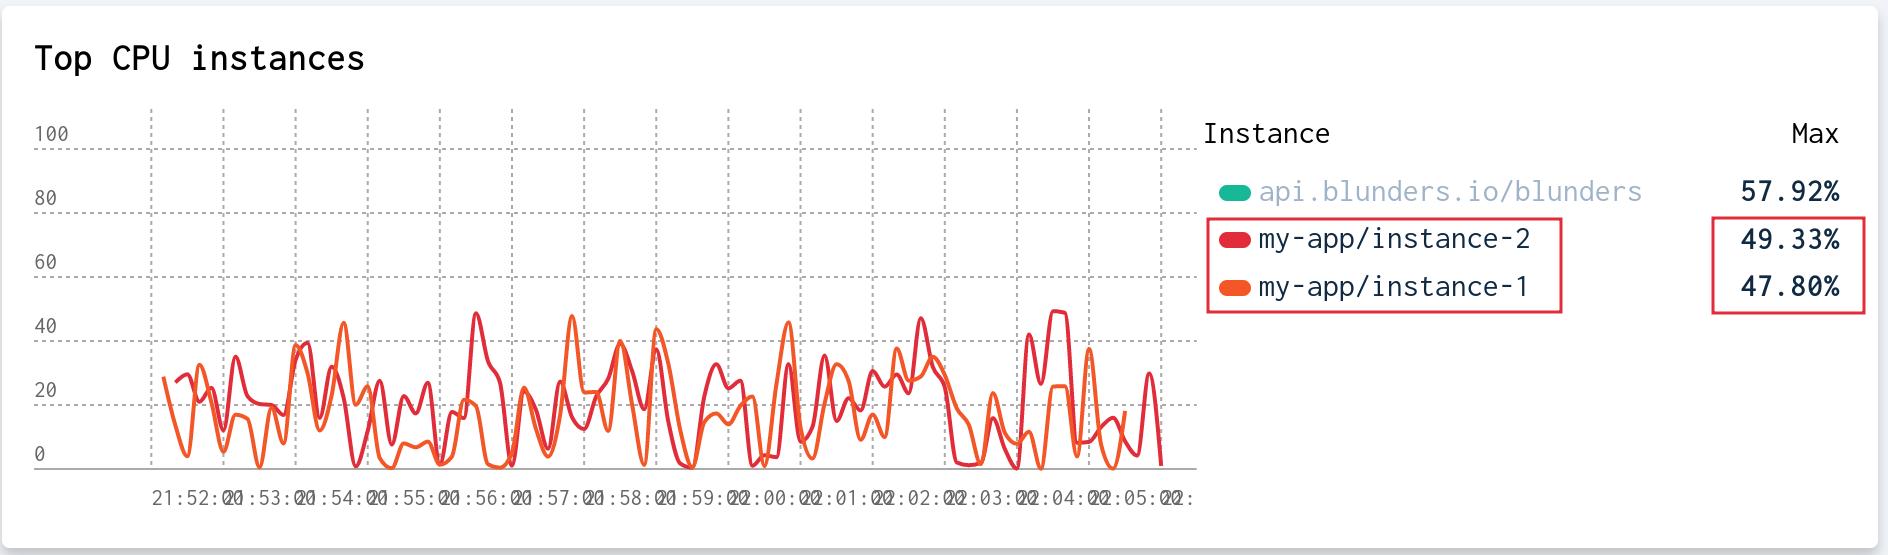
CPU and Memory Charts
There are two charts on the dashboard. One shows the CPU usage and the other the allocation rate. Each chart shows the instances using the most of each resource. You may filter to specific instances by clicking on the instance's name on the right.
Clicking the CPU usage or Allocation rate takes you to a the detail view of that instance.
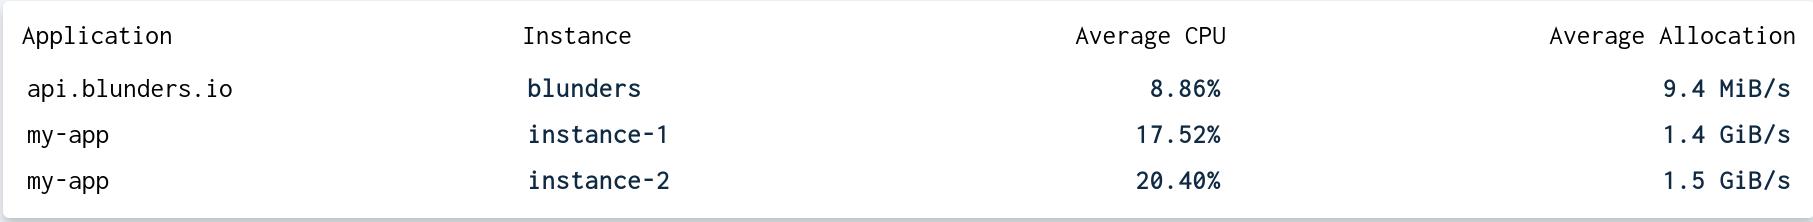
The Instance Table
At the very bottom there is a table with all the instances in your account, including their average CPU and allocation rate for the selected timespan. You can click the instance's name, CPU or Allocation Rate numbers to get to the detailed view of the instance.