CPU Profiling
CPU Profiling is all about finding out which code paths use the most CPU. The CPU profiling tab lets you do this using a format called "Flame Graphs". For the CPU view, the graph shows the call stack where code paths that take up a lot of CPU time as wider elements.
Top Down
Viewing the Flame Graph in a top-down manner is useful to get an overview of which part of the application is using the most CPU. The Top Down view is useful when you do not know which part of the application is using the most CPU.
It is often the case that unexpected parts of the application uses the most CPU - you might have been optimizing a core loop just to find that a log statement in a completely different place is the most time consuming. The top down view helps you in this.
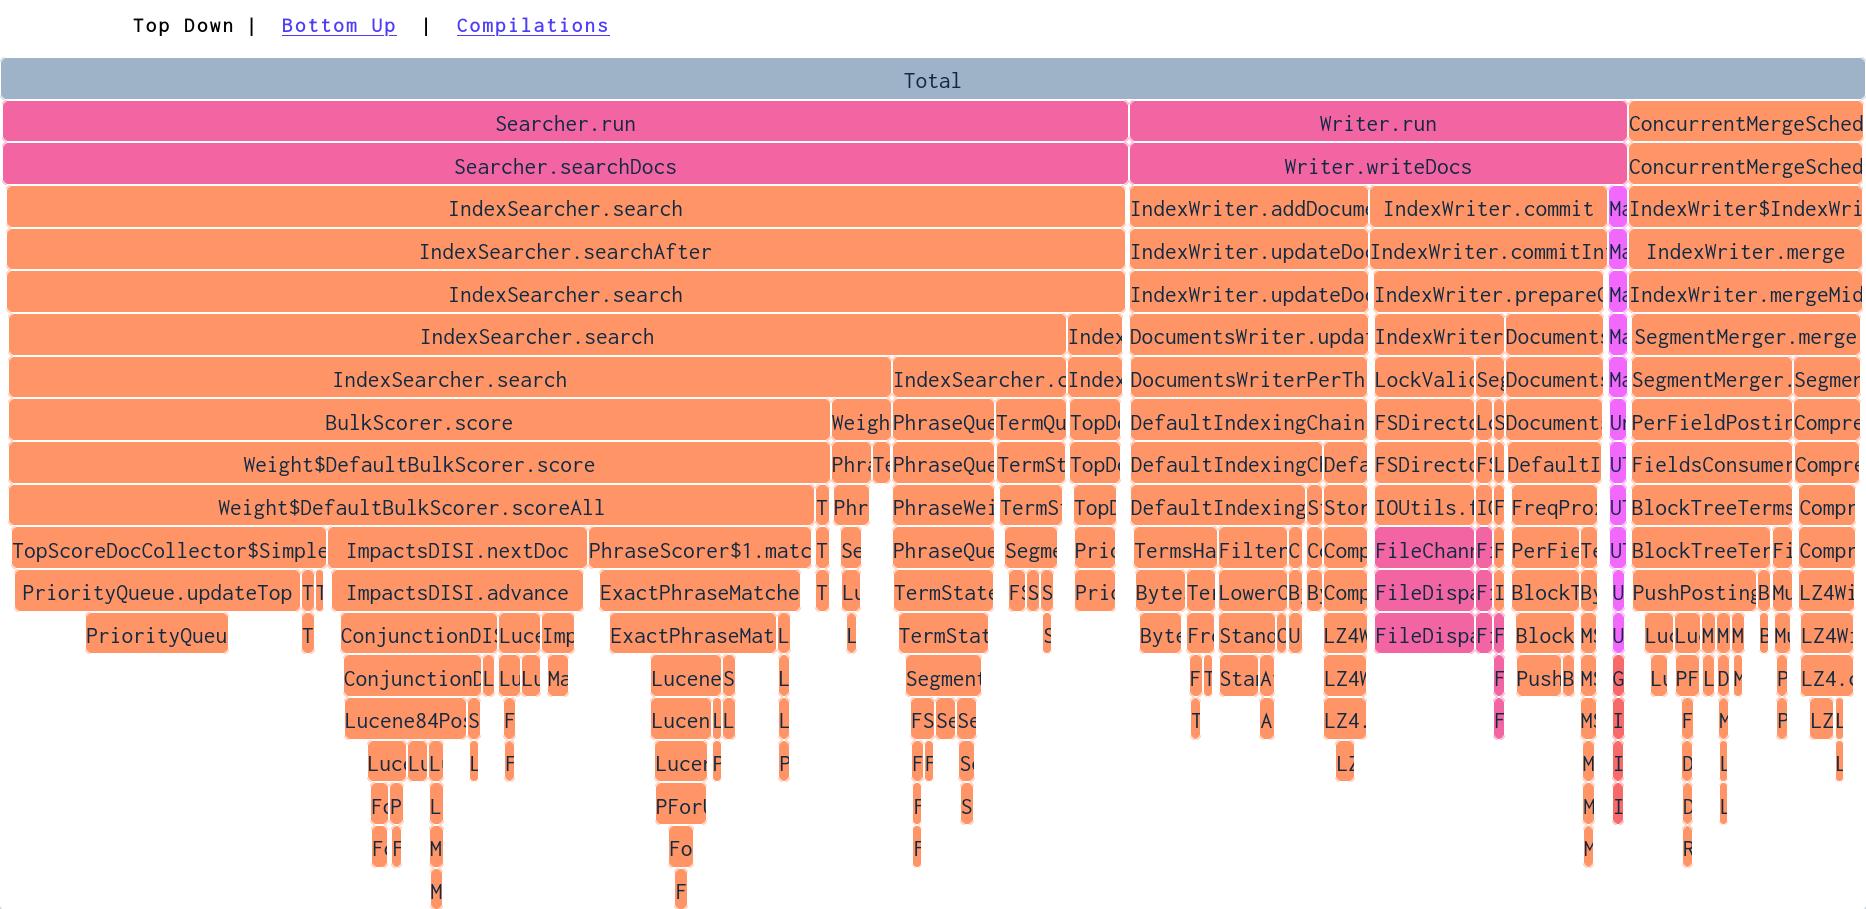
In the image above, we are looking at a demo application which uses Lucene to index documents and search for them. In it, we can see that about 60% of the CPU is used for searching. The Searcher.searchDocs method calls the IndexSearcher.search method. The fact that these two are as wide, means that Searcher.searchDocs uses almost no CPU in it's own body - the width represent the CPU time of all the methods below.
Things get interesting in the IndexSearcher.search methods - where the call stack splits again. By clicking on the method, we can zoom into this part of the call stack:
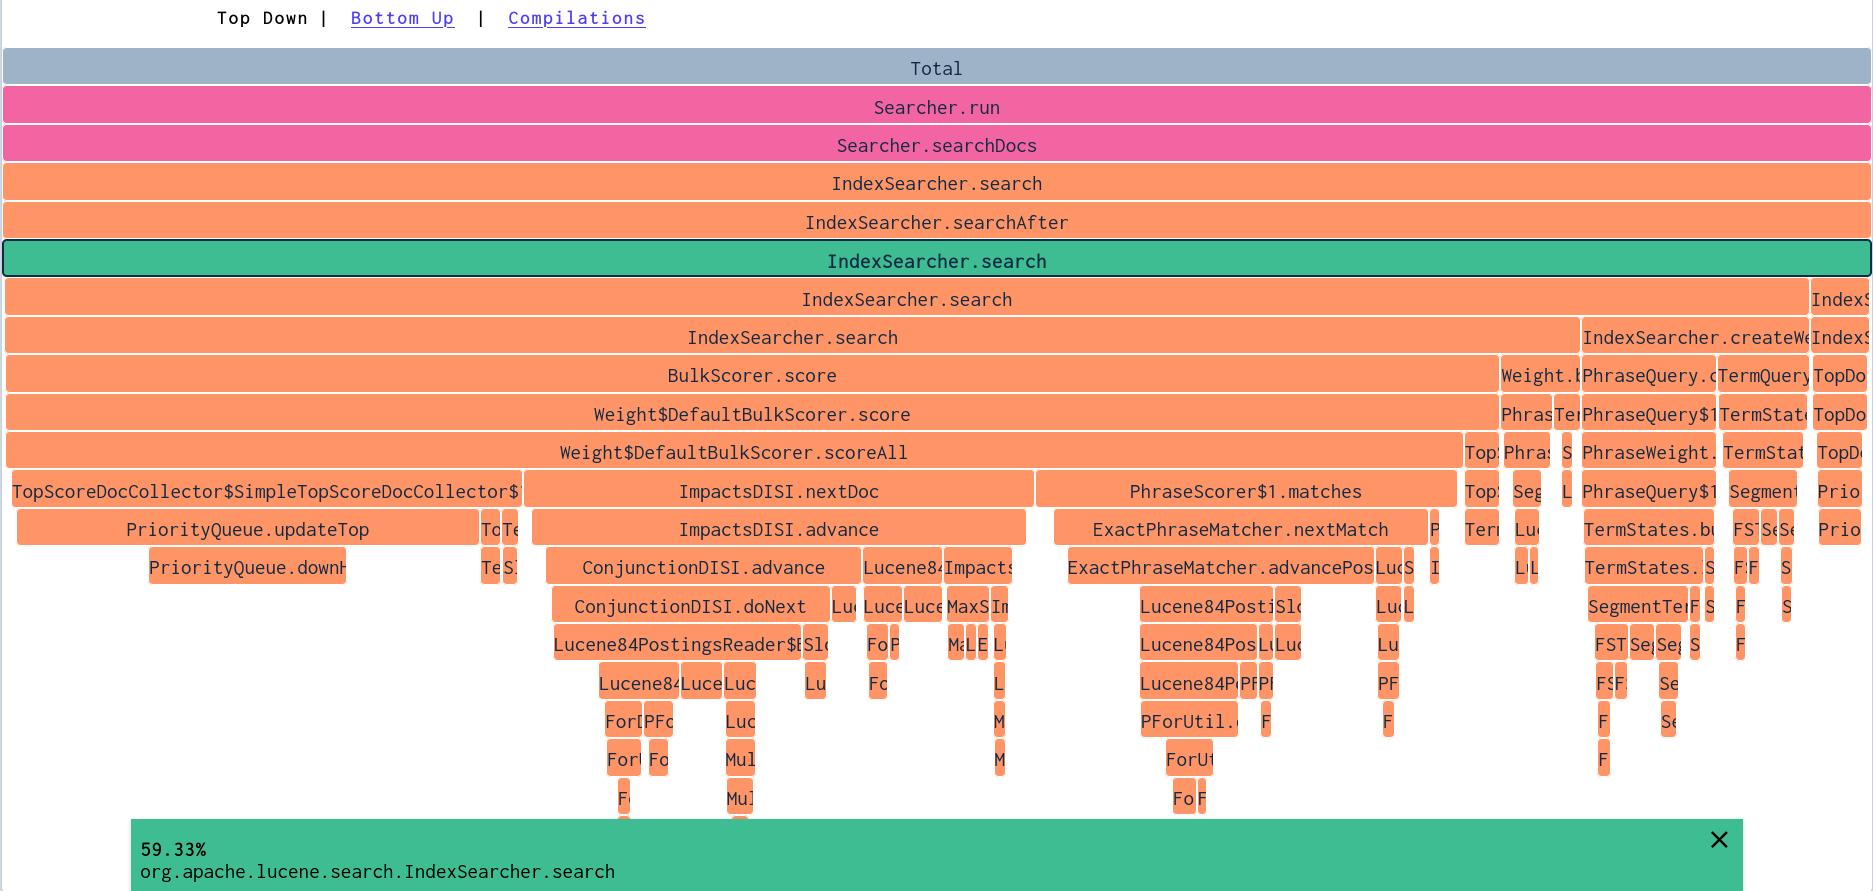
By looking at the zoomed in view, we can discover which phase of the search takes up the most time. Here we see that the TopScoreDocCollector uses a Priority Queue, which seems to be eating up some CPU time in PriorityQueue.updateTop .
Bottom up
The bottom up view turns the view upside down. The methods that consume the most CPU in their own method body are the ones most visible. This is very useful in identifying when a single, or a few, methods uses large amounts of CPU power. It is less good at identifying over-arching patterns, where the top down view works better.
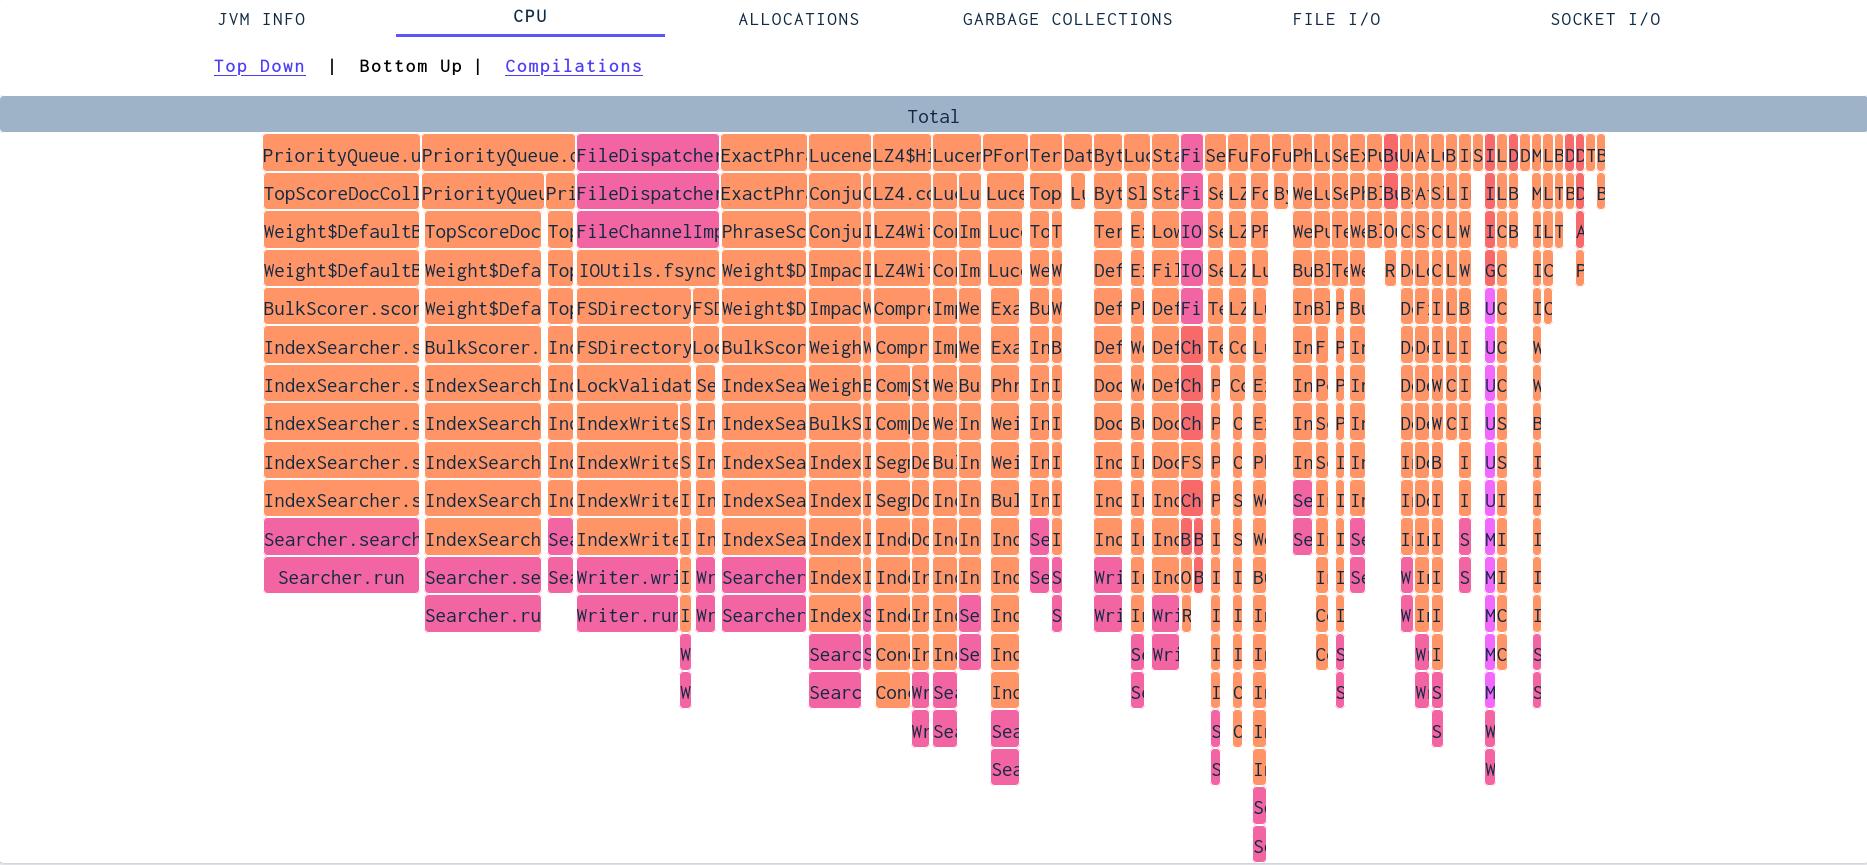
In this view, we see that methods in the PriorityQueue uses quite a bit of CPU, and where they are called from. This opens two opportunities for making the application faster: make the methods faster or call them less. Since this is a core data structure in Lucene I would be surprised if we could significantly improve it - however we can probably make sure to call it less or with less challenging inputs. Most methods are however not as optimized as Lucene code - and easier to improve.