Heap Allocation Profiling
Profiling of allocations is done to figure out which part of the application is allocating the most memory. High allocation rates is fairly common in Java Code - both Object Oriented and Functional Programming paradigms encourage the use of objects which ends up as allocations.
Reducing allocations is usually the most effective way to target excessive Garbage Collections - way easier than Garbage Collection tuning. Reducing allocations can also have a impact on how effective the CPU caches are - which can have dramatic effects on your performance.
The first step in fixing a problem is knowing that you have one. Use the allocation rate chart and the drill down views to dig deeper.
The Top Down View
Similar to how the CPU profiling worked, the Top Down View shows us an overview of which parts of the application allocates the most memory. Each row's width corresponds to how much memory that method, and it's children, allocated. This is useful to get an overview of which parts of the application is allocating the most memory.
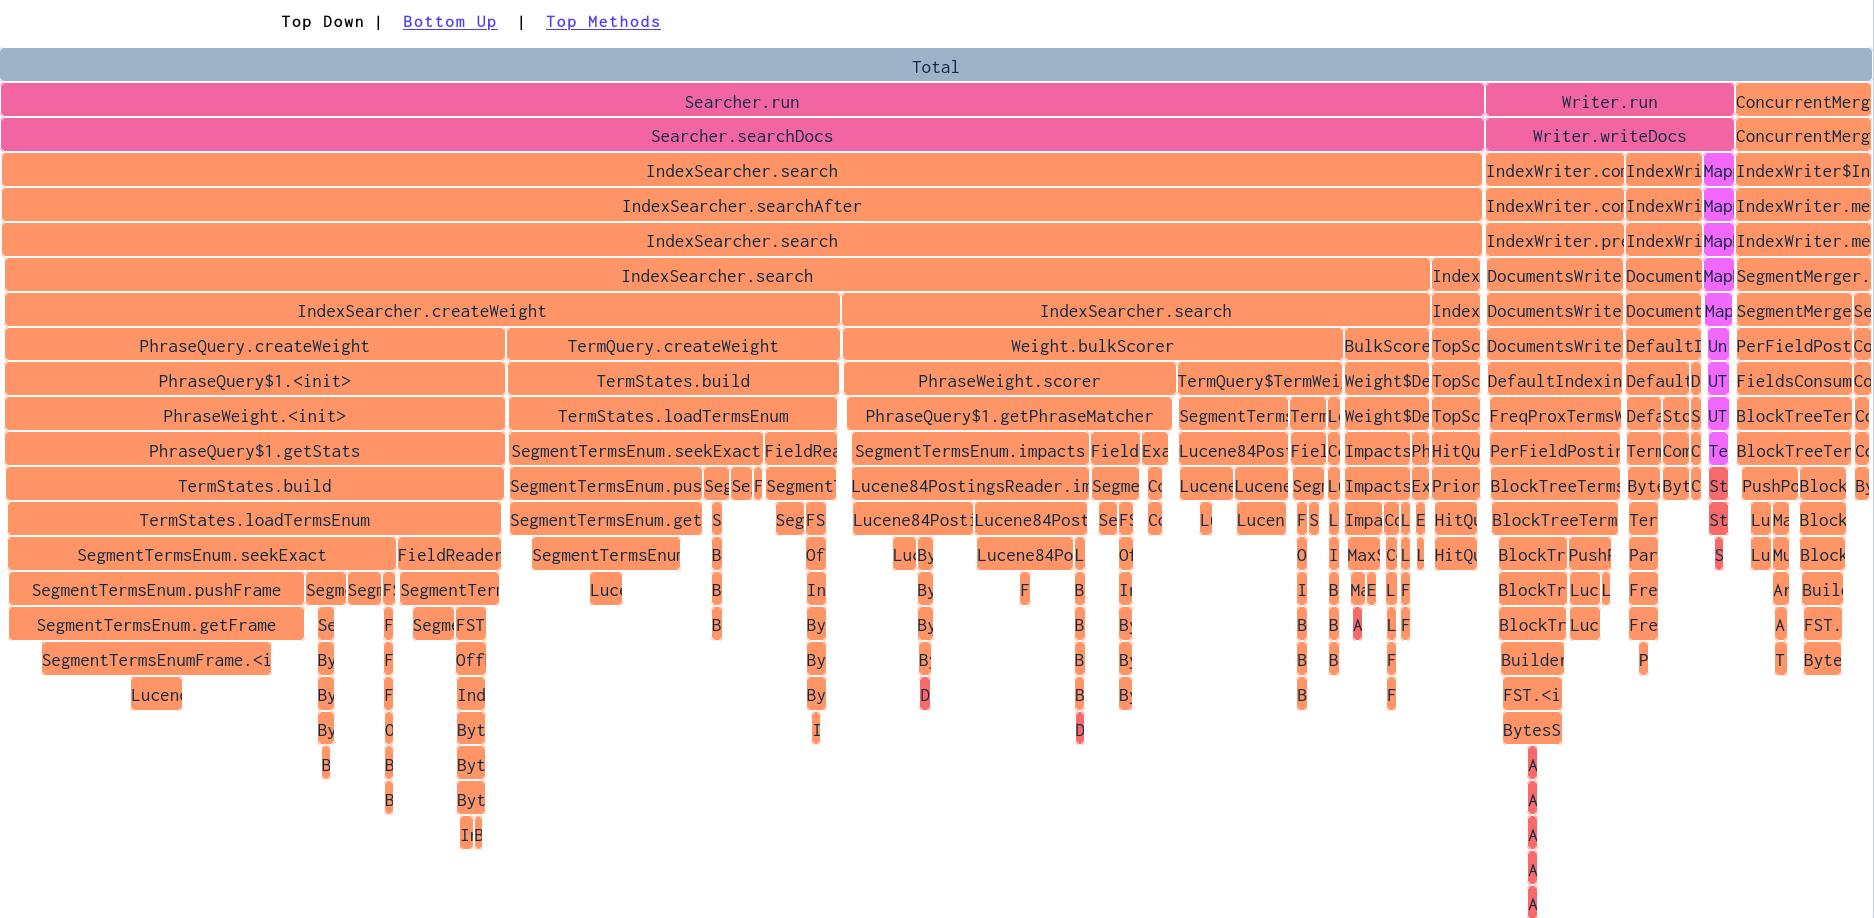
In this screenshot above we are looking at a demo application which uses the Lucene library to index and search some wiki data. By looking at it from the top, we can see that methods called by Searcher.run allocates about 80% of the memory allocated by the application during this time span. By going down the stack, we can see that the PhraseQuery.createWeight method seems to allocate a lot.
By clicking on an element, we can zoom in on a particular method. Zooming in expands the element and it's children, making it easier to see patterns in the call stack. This zoomed in view also tell us more about what kind of objects are allocated in a method and it's children.
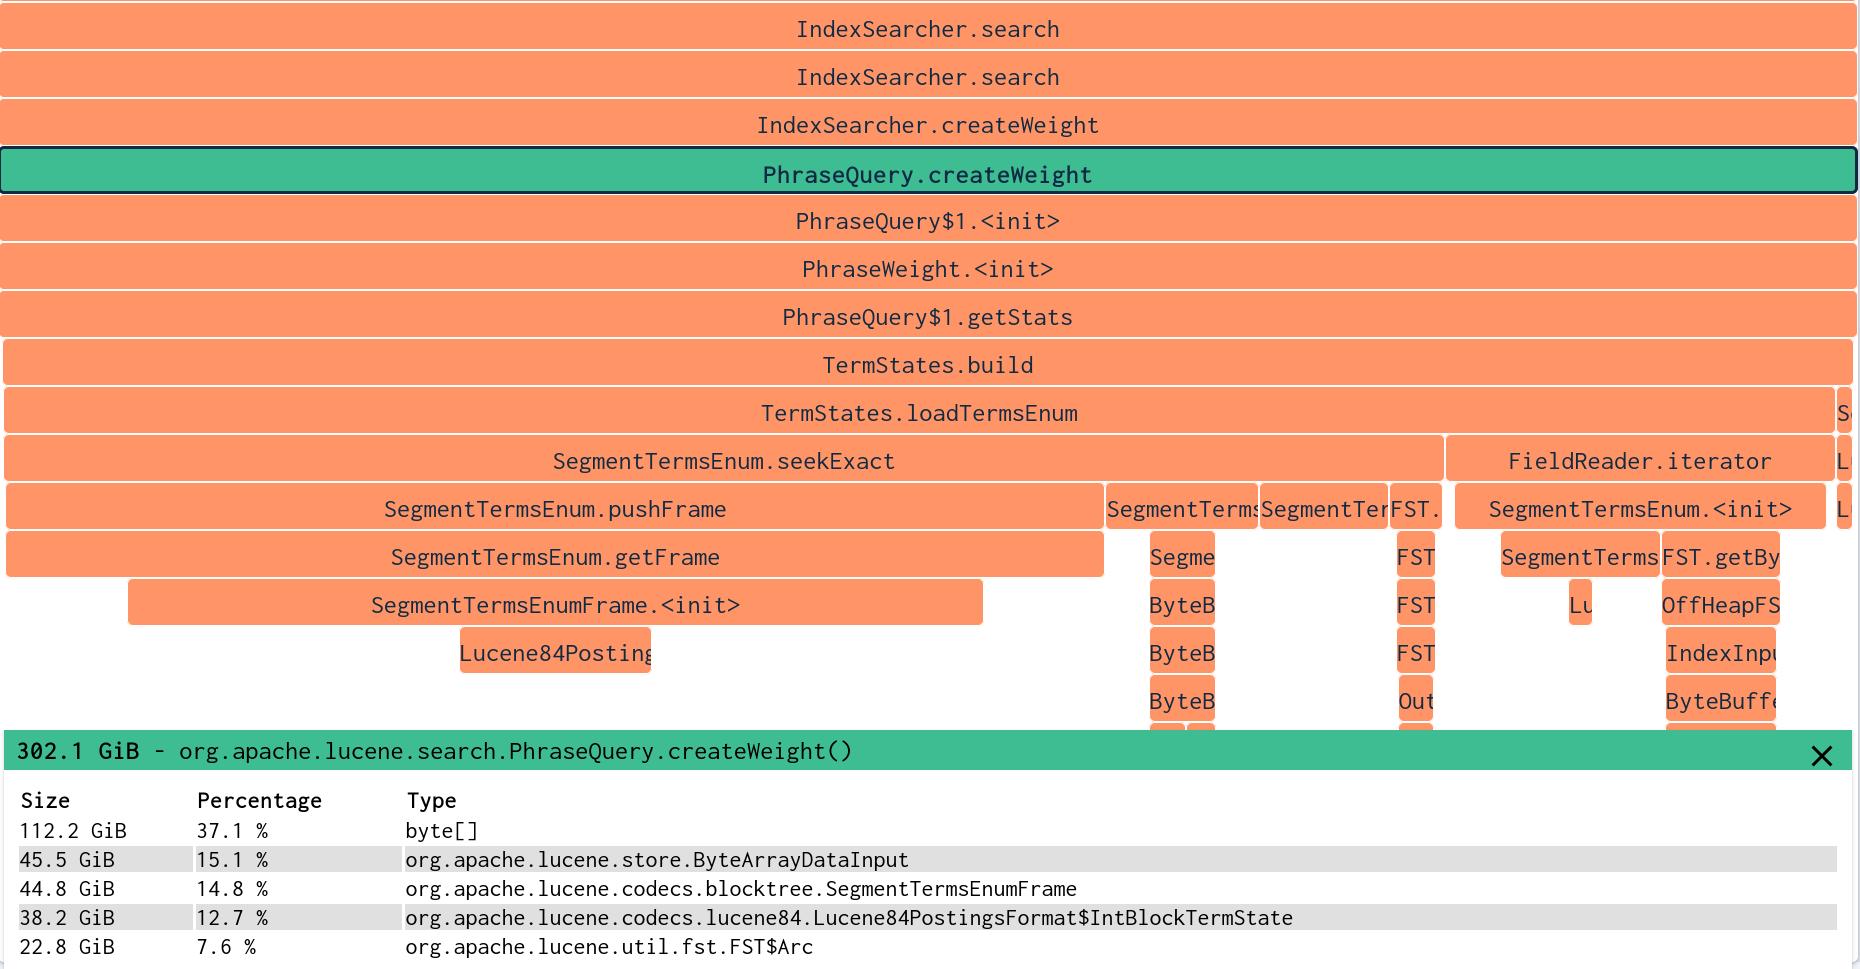
Here we have zoomed in on the PhraseQuery.createWeight method. We can see that most of the allocations happen in a child called TermStates.loadTermsEnum . We also see which types of objects are allocated in the children - byte arrays are the most allocated resource. By digging down deeper into the stack we can find exactly where we can reduce allocations.
Bottom Up
As when profiling for CPU, we can also chose to see the Flame Chart reversed. This is useful for finding specific methods that allocate lots of memory, to see which methods you would gain the most from optimising.
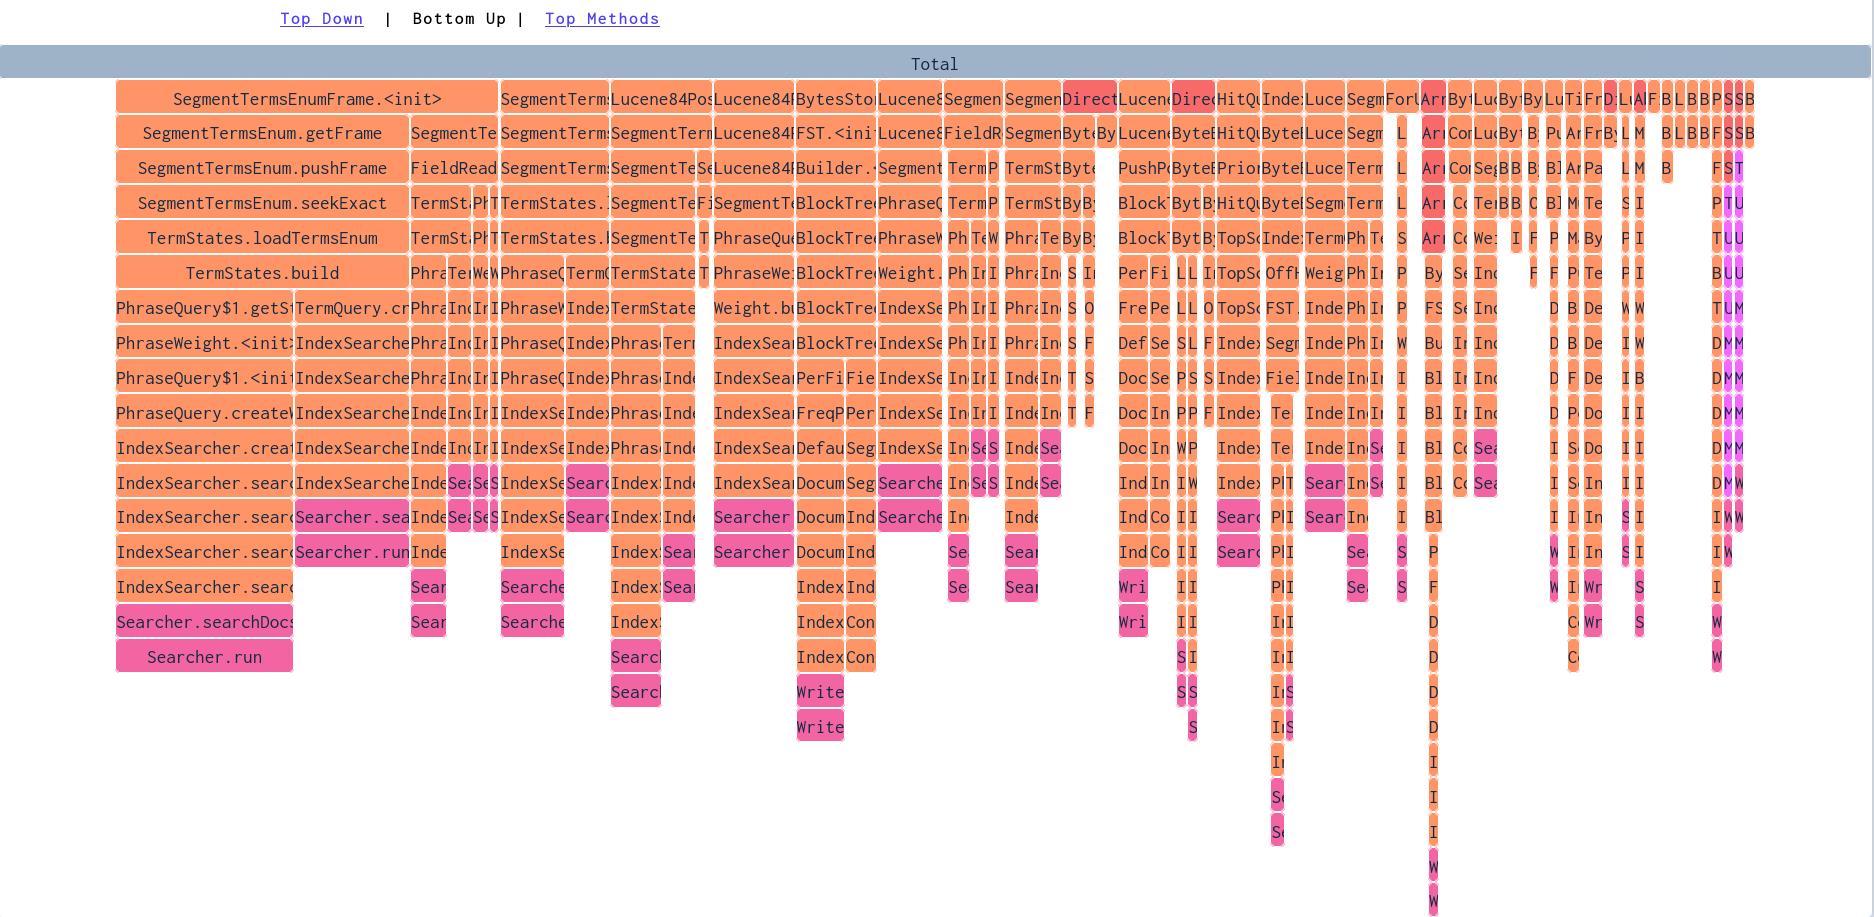
In the image above we see that the constructing instances of SegmentTermsEnumFrame is allocating the most memory over the selected period.
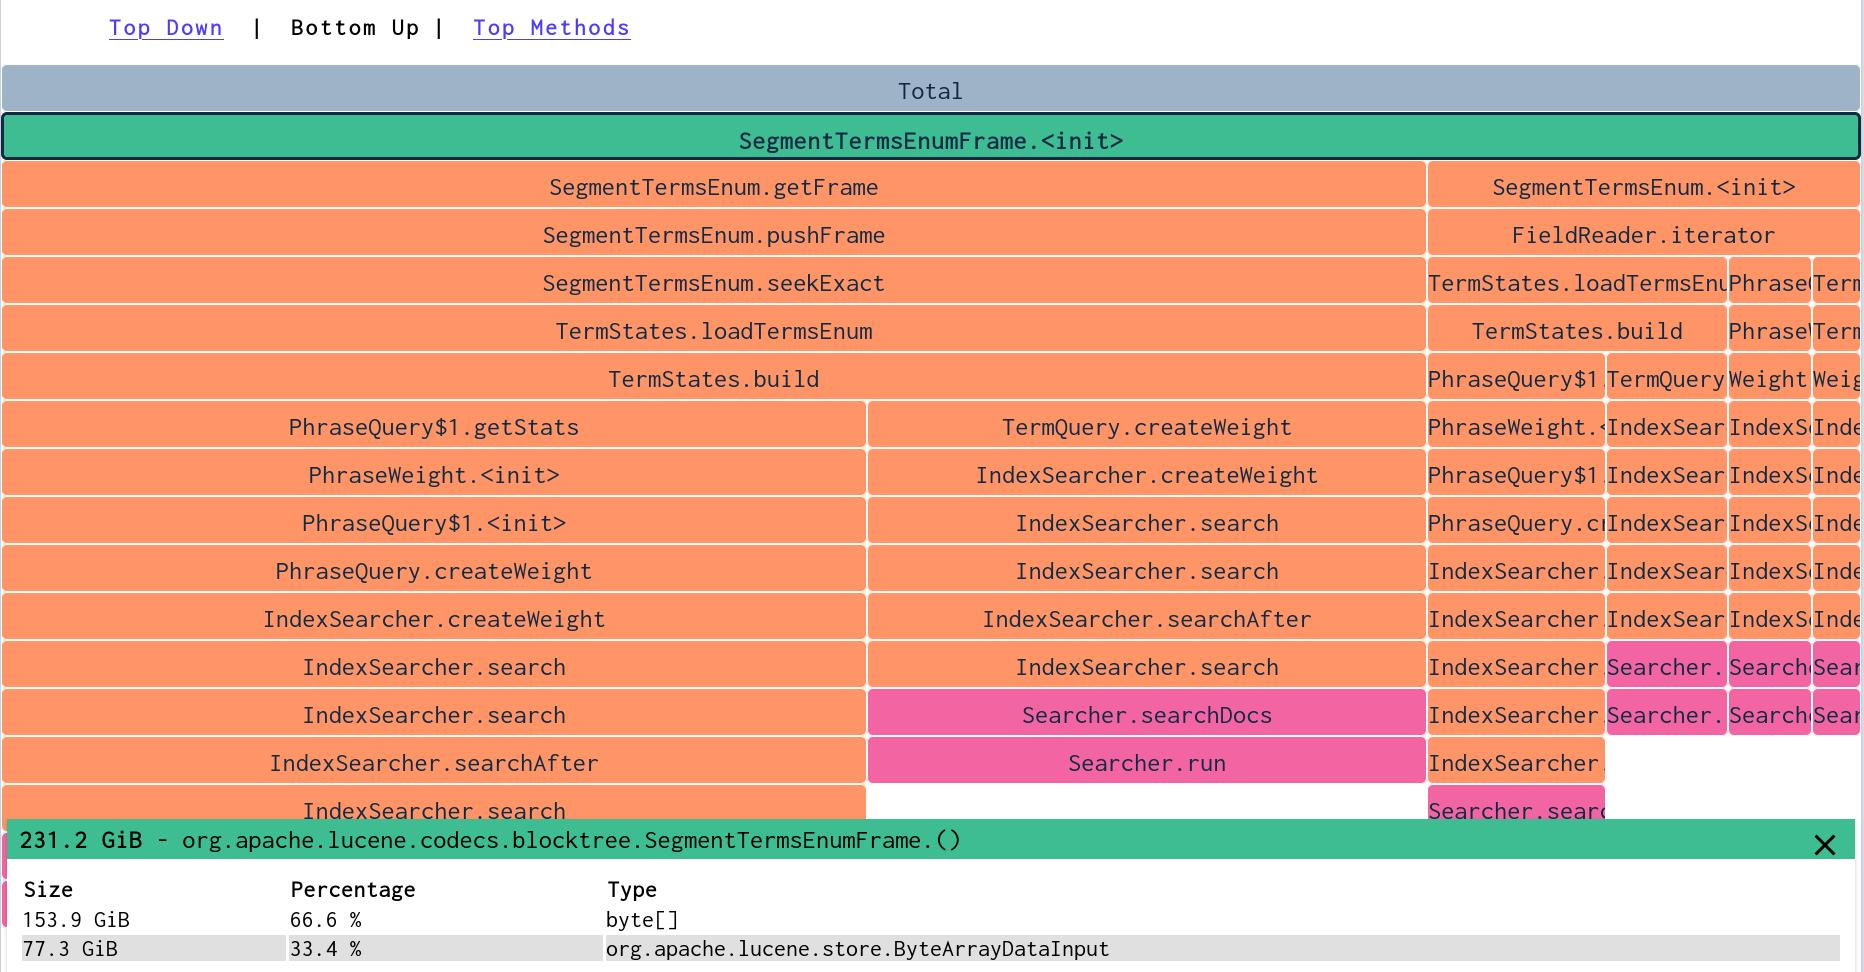
Here we can see that creation of SegmentTermsEnumFrame instances allocate byte arrays and instances of ByteArrayDataInput . We can also see that it is called from SegmentTermsEnum.getFrame and from creation of SegmentTermsEnum instances.
We can use this information to see if we could optimize the code somehow - maybe the buffers that the byte arrays are used for should have a different size, or we can figure out ways to call the method less.
Top Methods
The Top Methods view is an alternative to the flame graphs, where the methods allocating the most memory are listed in a table. This gives less context around what is calling a method - but sometimes you do not want the context.
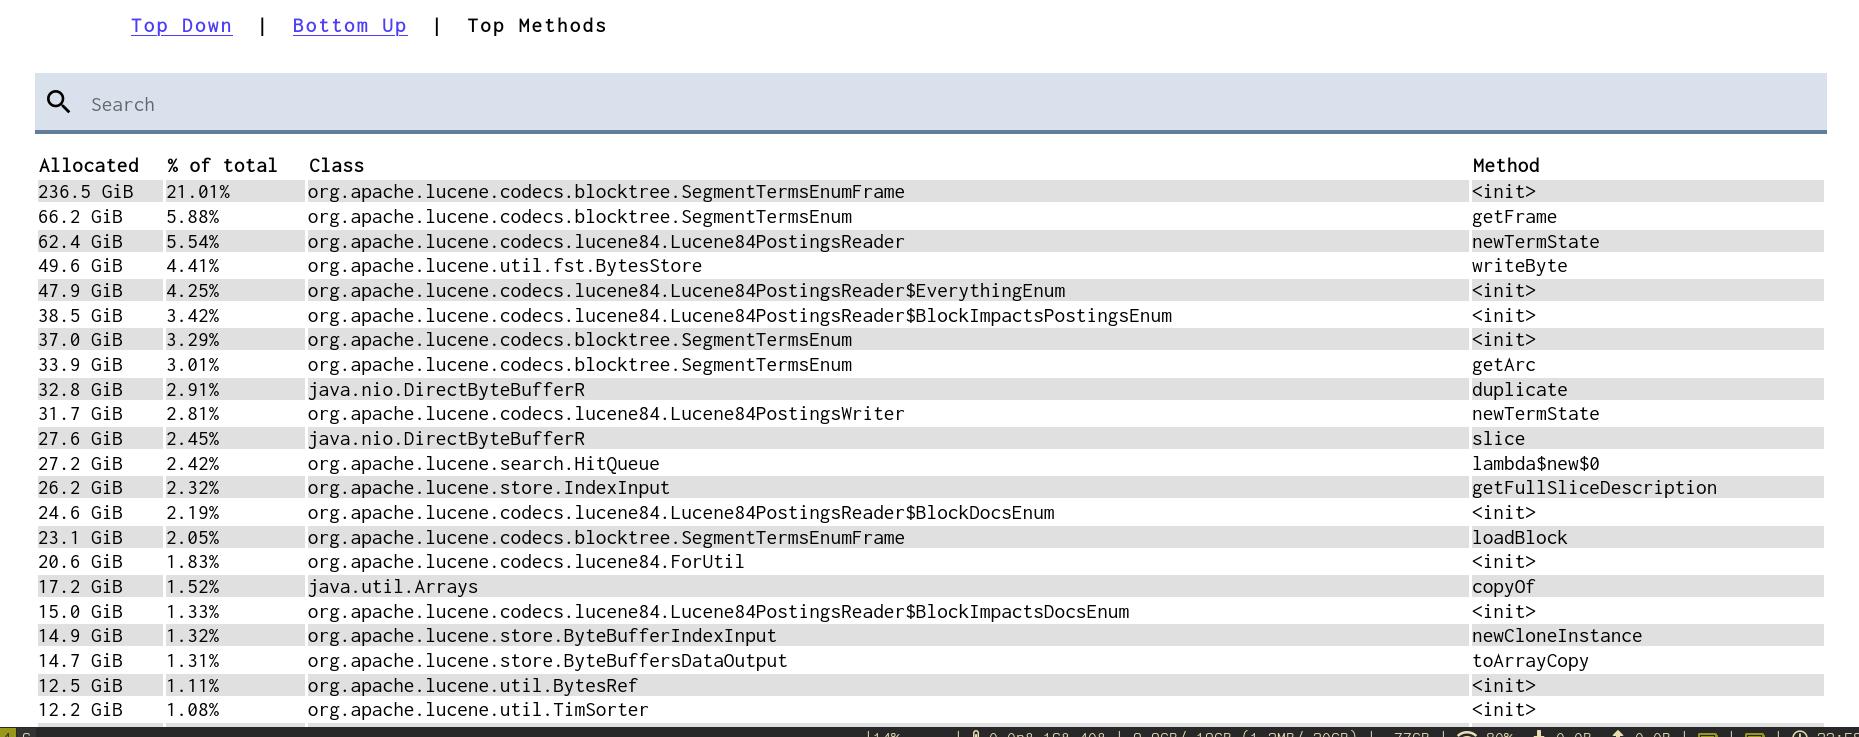
In the image above, we can again see that creation of SegmentTermsEnumFrame instances are allocating a lot of memory. Clicking a row shows which objects that method allocates.