Profile Java Applications in Production, with Ease.
Effectively improve the performance and stability of Java/JVM applications.
Book a Demo
Find out how Blunders can help your business today. Book a demo with us.
What our customers say
“Blunders.io helps us swiftly identify performance issues at a very granular level, saving us both engineering time during investigations and money as we optimize bottlenecks.
“Blunders is my favorite devtool. We’re building a high-performance application and we have Blunders profiling enabled during development and in production.
I don’t think we would have been able to build this product without Blunders and I now hesitate to using languages that Blunders does not support.
What is a Profiler?
A profiler highlights which parts of a computer program uses the most resources, such as CPU and Memory. This helps developers improve the performance of the program, making it faster and more reliable.
Blunders makes it easy to continuously profile large amounts of applications in production. This lets you immediately see what happened 3 days ago, instead of first trying to reproduce it locally.
How does Blunders work?
1Attach the Blunders Agent
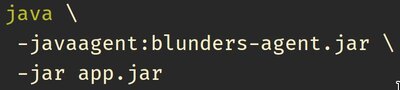
Attach the Blunders agent your application. This can also be done programmatically.
2Notice spikes
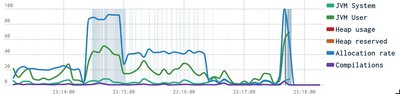
Blunders highlights changes in behaviour of your application.
3Drill down
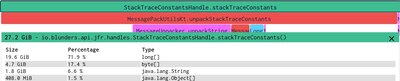
Blunders lets you dig down into which code paths are allocating the most memory and using the most CPU.
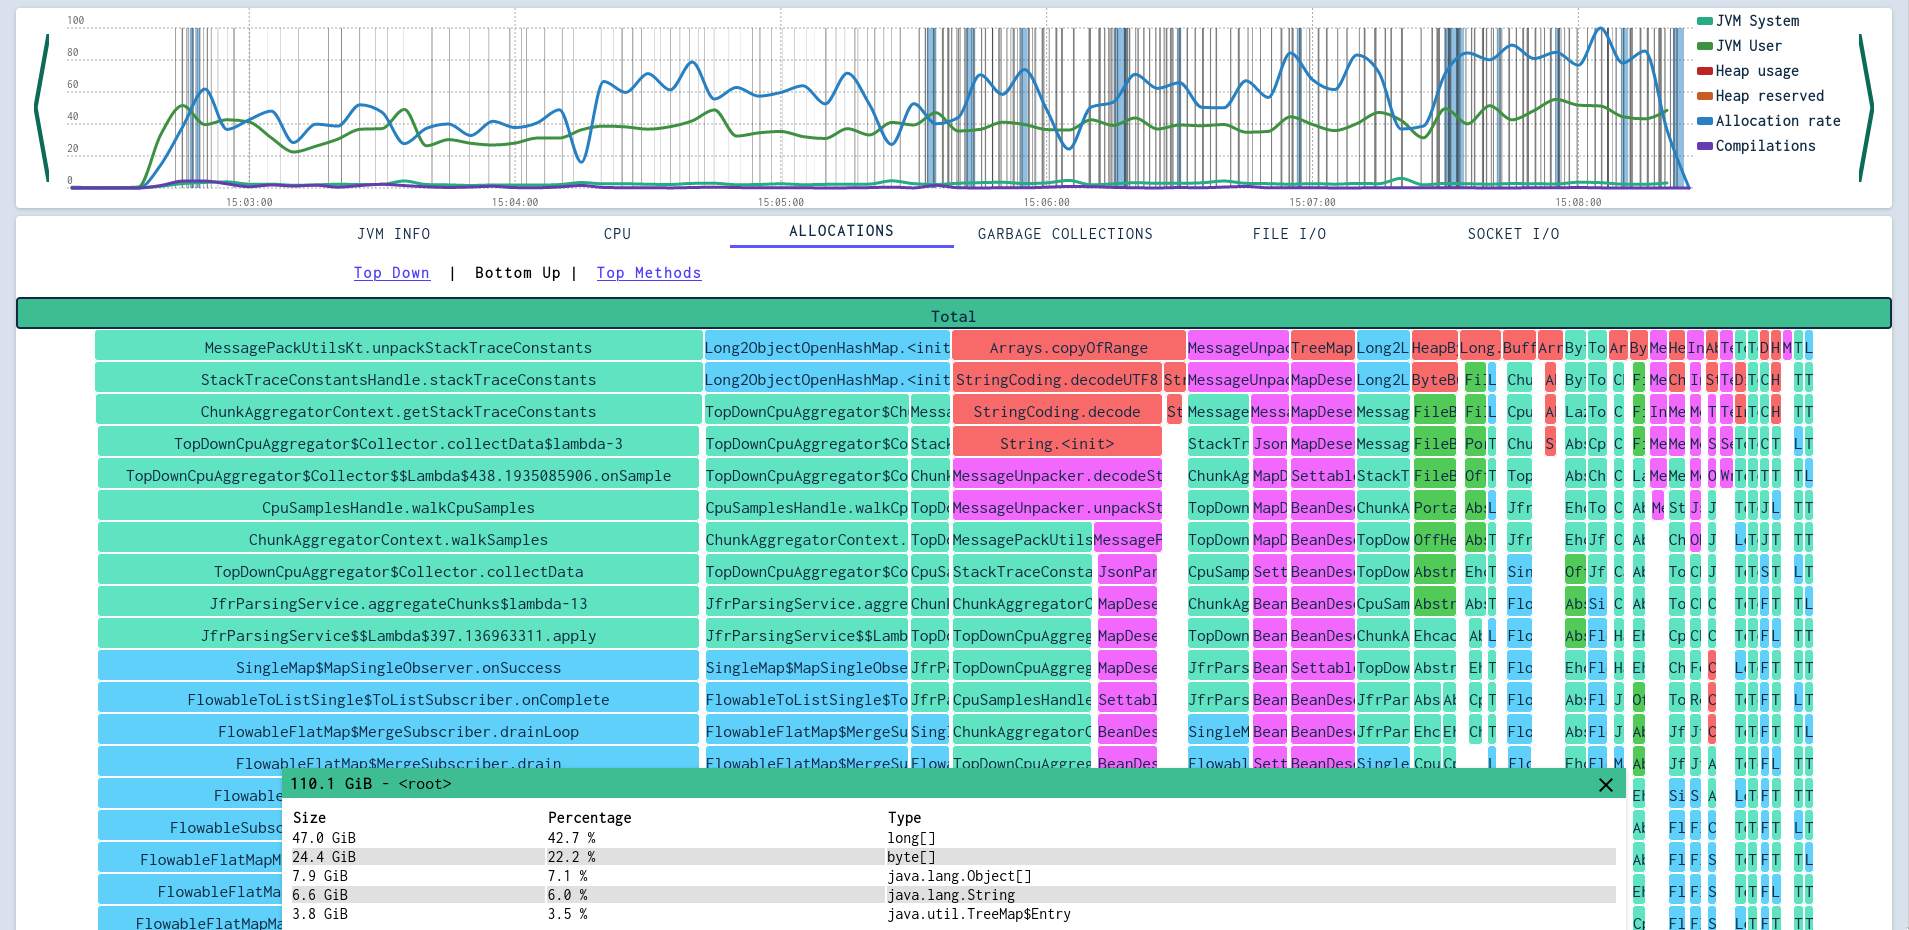
Make understanding performance easy
Understand what your applications are doing in production, right now. Blunders provides easily accessible flame graphs that help you get to the bottom of your performance issues.
Invite team members to collaborate, all you need is a browser. Profiling is a great way to learn the codebase.
Want to see what it feels like?
Why Blunders?
Know what is worth optimizing
Do not waste hours optimizing code paths that do not have an impact. Avoid premature optimization, spend your time where it matters.
Response times matter
Keep more users with more responsive pages and applications.
Improve stability
CPU starvation and Garbage Collection issues can bring down applications. Understand how to prevent them with Blunders.
Lower Infrastructure Costs
More efficient applications uses less resources. Blunders shows you how.
Pay as you go
Blunders is priced per hour and CPU core.
You only pay for what you use.
$0.002 / CPU core & hour
(~ $1.44 / CPU core & month)
Unlimited amount of users.