Elasticsearch Benchmarking, Part 3: Latency
Published 2024-01-15
Author: Anton Hägerstrand, anton@blunders.io
This post is the third of a series where we try to understand the details of a benchmark comparing Elasticsearch and OpenSearch, originally posted in this blog post by Elastic. In this post, we will first have a look at the numbers that I got when running the benchmark locally. We will then have a look at why some of these results are problematic, and how that applies to the original benchmark done by Elastic.
tl;dr;
Unfortunately, I don't believe that the original benchmark by Elastic says much about the relative performance of Elasticsearch vs. OpenSearch. This is due to some shortcomings that the original benchmark seems to suffer from:
- Some query benchmarks are either unreproducible or match no documents
- Most aggregations requests seems to have been served from cache
- For many queries, network latency probably had a larger impact that in-process execution time
To understand how I came to these conclusions and understand the nuances, read on.
Benchmarking locally
The starting point for this post is a benchmark I ran locally - later in the post we will compare this to the benchmark done by Elastic for their blog post.
Benchmarking setup
The benchmark setup is the same is in the previous post. I aim to replicate the benchmark posted by Elastic locally. The hardware is a desktop with AMD Ryzen 5 5600X CPU, 32 GB of RAM and a 2 TB NVMe SSD. I indexed the same 1,740,763,348 documents into both Elasticsearch and OpenSearch. The data used in this benchmark are fake logs.
For Elasticsearch, I used version 8.11.0 and OpenSearch 2.11.0 - the latest versions when I started this series. All tests use their bundled JVM versions; openjdk 21.0.1 for Elasticsearch and openjdk 17.0.8 for OpenSearch.
For more details on indexing, see the previous posts in this series.
Initial Results
So, I ran the same big5 benchmark used in the original blog post by Elastic - the benchmark is available as a Rally challenge in the elasticsearch-opensearch-benchmark repository. I'd again like to thank Elastic for making this repository available.
All numbers below are of the 90th percentile response time, in milliseconds. I chose the 90th percentile to be able to compare it more easily with the Elastic blog post, which used the same p90 metric.
| Operation | Elasticsearch | OpenSearch | Diff % |
|---|---|---|---|
| default | 4.76263 ms | 5.18139 ms | +8.79% |
| desc_sort_timestamp | 833.817 ms | 952.386 ms | +14.22% |
| asc_sort_timestamp | 835.487 ms | 940.966 ms | +12.62% |
| desc_sort_with_after_timestamp | 732.887 ms | 914.375 ms | +24.76% |
| asc_sort_with_after_timestamp | 841.896 ms | 928.586 ms | +10.30% |
| desc_sort_timestamp_can_match_shortcut | 146.348 ms | 152.954 ms | +4.51% |
| desc_sort_timestamp_no_can_match_shortcut | 147.016 ms | 153.644 ms | +4.51% |
| asc_sort_timestamp_can_match_shortcut | 148.022 ms | 159.648 ms | +7.85% |
| asc_sort_timestamp_no_can_match_shortcut | 150.459 ms | 160.864 ms | +6.92% |
| term | 2.45643 ms | 2.31853 ms | -5.61% |
| multi_terms-keyword | 3.40334 ms | 3.48468 ms | +2.39% |
| keyword-terms | 10.0521 ms | 10.9291 ms | +8.72% |
| keyword-terms-low-cardinality | 2.86985 ms | 3.19105 ms | +11.19% |
| composite-terms | 2.85522 ms | 2.97549 ms | +4.21% |
| composite_terms-keyword | 2.74237 ms | 2.71656 ms | -0.94% |
| composite-date_histogram-daily | 2.44055 ms | 2.78075 ms | +13.94% |
| range | 1964.79 ms | 3537.2 ms | +80.03% |
| range-numeric | 2.12592 ms | 2.23988 ms | +5.36% |
| keyword-in-range | 1970.58 ms | 3552.7 ms | +80.29% |
| date_histogram_hourly_agg | 2.67675 ms | 2.94927 ms | +10.18% |
| date_histogram_minute_agg | 13.4135 ms | 14.6717 ms | +9.38% |
| scroll | 551.855 ms | 649.293 ms | +17.66% |
| query-string-on-message | 6.18552 ms | 1361.48 ms | +21910.76% |
| query-string-on-message-filtered | 1095.17 ms | 1738.46 ms | +58.74% |
| query-string-on-message-filtered-sorted-num | 370.704 ms | 746.97 ms | +101.50% |
| sort_keyword_can_match_shortcut | 3.70997 ms | 3.6578 ms | -1.41% |
| sort_keyword_no_can_match_shortcut | 3.42068 ms | 3.33667 ms | -2.46% |
| sort_numeric_desc | 729.779 ms | 1308.88 ms | +79.35% |
| sort_numeric_asc | 773.676 ms | 825.3 ms | +6.67% |
| sort_numeric_desc_with_match | 2.10659 ms | 2.02501 ms | -3.87% |
| sort_numeric_asc_with_match | 2.02636 ms | 1.96824 ms | -2.87% |
| range_field_conjunction_big_range_big_term_query | 2.09902 ms | 2.14582 ms | +2.23% |
| range_field_disjunction_big_range_small_term_query | 2.04042 ms | 2.03686 ms | -0.17% |
| range_field_conjunction_small_range_small_term_query | 1.96933 ms | 2.06369 ms | +4.79% |
| range_field_conjunction_small_range_big_term_query | 1.9935 ms | 1.97538 ms | -0.91% |
| range-auto-date-histo | 3.15707 ms | 3.82719 ms | +21.23% |
| range-auto-date-histo-with-metrics | 2.67703 ms | 3.13117 ms | +16.96% |
These are a lot of numbers - but we see a few different patterns:
- The query-string-on-message-* queries , as we saw in the previous post, has some major issues. I'd encourage you to not draw any conclusions from the results for any of the query-string-on-message-* operations, and read the last blog post if you wonder why.
- Elasticsearch seems to be slightly faster than OpenSearch at sorting. We saw one reason possible reason why (a newer Lucene version) in the previous post.
- The range , keyword-in-range and sort_numeric_desc operations differ by a lot between Elasticsearch and OpenSearch. This is due to quite interesting reasons involving the JIT. I first intended this post to be about that, but the post got to long. We will explore this in the next post.
- Most other queries are really fast - usually around 2-3 ms in p90. I did a bit of digging,
and found that these fast queries fall in two categories:
- Queries that have no matches
- Queries that are cached
In this blogpost, we'll focus on the last bullet point. We will explore how my local results compares to the original benchmark done by Elastic, and how that impacts how you should interpret the benchmark.
Queries Not Matching Any Documents
Neither the term query, the range-numeric , nor the *{big|small}_range}* queries match any documents in the dataset I generated. I generated the dataset as instructed in the repository.
Running queries that match no documents is of course a valid benchmark. But search times can vary quite a bit depending on the number of matched documents. The term and numerical-range queries are executed using different types of index data structures, but both allow for early-exit if there are no matches.
The term Query
The term query used in the Rally benchmark searches the log.file.path field for /var/log/messages/fuschiashoulder . This value was not generated by the data generation setup. The dataset does contain similar values though, e.g. /var/log/messages/ripplepalm .
Let's run a term query with matches, and see how long it takes. I tested using this query, which matches 122,933 documents:
{
  "query": {
    "term": {
      "log.file.path": {
        "value": "/var/log/messages/ripplepalm"
      }
    }
  }
}
I used Apache Bench for this, but now running only one concurrent request (the same as Rally does):
ab -l -t 60 -c 1 -T 'application/json'\
 -p ripplepalm.json\
 localhost:9200/logs-benchmark-dev/_search
Here, both Elasticsearch and OpenSearch got a 90th percentile of 2 ms. This is lower than the no-match from above - due to a lower overhead in Apache Bench than Rally. For reference, the 90th percentile for the no-match fuschiashoulder query was reported as 1ms by Apache Bench for both Elasticsearch and OpenSearch.
So, term queries are really fast in Lucene. No surprise there.
I don't know if the original benchmark suffers from this issue. In their setup, the generator might have generated /var/log/messages/fuschiashoulder . If so, it means that the benchmark is not reproducible.
The range-numeric and *{big|small}_range}* Queries
The range-numeric and the *{big|small}_range}* queries searches the metrics.size field for ranges. The problem is that all queries for it searches for ranges below 200. In my generated data, the minimum value for this field is 1000.
Here, the original Elastic benchmark should be affected, since the data generation setup specifies that the minimum generated value should be 1000:
- name: metrics.size
  fuzziness: 0.1
  range:
    min: 1000
    max: 10000
The full source for the data generation setup is available in the benchmark repository
A side note here is that the range_field_disjunction_big_range_small_term_query and the range_field_conjunction_small_range_small_term_query (which is miss-labeled, it is a disjunction) could have matched documents in the Elastic benchmark post, since the other query in the disjunction ("or") searched for terms in the log.file.path field. The issue is similar to the term query above.
How Fast is a range-numeric query with hits?
Just for fun, let's run a numerical range query that matches some documents:
{
  "query": {
    "range": {
      "metrics.size": {
        "gte": 1100,
        "lte": 1200
      }
    }
  }
}
I ran this query using Apache Bench (again, 1 concurrent request). For Elasticsearch the reported 90th percentile was 433 ms, while it was 461 ms for OpenSearch. I also ran the original range-numeric (without hits) query using Apache Bench, and got a 90th percentile of 1 ms for both Elasticsearch and OpenSearch.
Cached Requests
Both Elasticsearch and OpenSearch has a Shard Request Cache which will cache results of most aggregation-only queries. This cache is conceptually very simple; given the exact same shard-level request the shard-level response will be cached in memory. This cache is enabled by default.
I noted that some requests that had no business being fast were, in fact, very fast. Were they cached? I attached a debugger to the IndicesService class in Elasticsearch and wrote down which requests ended up being cached when running the big5 benchmark.
After warmup, the following operations got completely cached by all shards: multi_terms-keyword , keyword-terms , keyword-terms-low-cardinality , composite-terms , composite_terms-keyword , composite-date_histogram-daily , date_histogram_hourly_agg , date_histogram_minute_agg , range-auto-date-histo , range-auto-date-histo-with-metrics .
In the Rally "challenge" we use, all operations have 200 warmup iterations, and 100 measured iterations. This means that the cache is always warm when measuring how long the queries took.
This of course explain why they all execute in ~2ms (as reported by Rally). I did not test OpenSearch, but it also had very fast response times for these operations. I believe that both ES and OS used the cache for these operations.
How Fast are Date Histograms without the cache?
The shard request cache is enabled by default in both Elasticsearch and OpenSearch, but can be disabled at query-time using the request_cache=false query parameter.
The request used for the date_histogram_hourly_agg operation looks like this:
{
  "size": 0,
  "aggs": {
    "by_hour": {
      "date_histogram": {
        "field": "@timestamp",
        "calendar_interval": "hour"
      }
    }
  }
}
Let's explore what happens to this request and it's sibling, the date_histogram_minute_agg request:
{
  "size": 0,
  "query": {
    "range": {
      "@timestamp": {
        "gte": "2023-01-01T00:00:00",
        "lt": "2023-01-03T00:00:00"
      }
    }
  },
  "aggs": {
    "by_hour": {
      "date_histogram": {
        "field": "@timestamp",
        "calendar_interval": "minute"
      }
    }
  }
}
We can run those with the request cache disabled, and see how long they take without any cache:
ab -l -t 60 -c 1 -T 'application/json'\
 -p date_histogram_hourly_agg.json\
 'localhost:9200/_search?request_cache=false'
I ran the different requests, with and without caching, for Elasticsearch and OpenSearch. The results paint a pretty clear picture. All numbers are the 90th percentile response time, in milliseconds.
| Operation | date_histogram_hourly_agg | date_histogram_minute_agg |
|---|---|---|
| Elasticsearch, no cache | 7136 ms | 4163 ms |
| Elasticsearch, with cache | 1 ms | 5 ms |
| OpenSearch, no cache | 6696 ms | 5043 ms |
| OpenSearch, with cache | 1 ms | 10 ms |
I.e. the histogram aggregation is quite slow. But in the benchmark results this is hidden by caching. A small side note here is that the minute histogram likely is slower due to response size - it is ~237 KB as opposed to the ~15 KB for the hourly histogram.
Benchmarking a Cache?
The shard request cache is a good thing. But it works only when the request to each shard is exactly the same, has "size": 0 (i.e. no hits) , and the data is not changed. This means that you will get a cache miss if, e.g.:
- A new document was indexed into the shard (and the index was refreshed)
- The query that you used changed the slightest, e.g. by choosing a different timespan
It is therefore problematic to use the shard request cache for benchmarking.
Is the original benchmark affected?
But, you might say, caching is clearly bad for benchmarking. Surely this must have bene a mistake in your local setup? The benchmark by Elastic can't have used caching? And indeed, in the blog post they say that:
We adhered to best practices for Elasticsearch and OpenSearch, including force merging indices before initiating queries and strategies to prevent influence from cached requests, thus ensuring the integrity of our test results.(emphasis mine)
And in the repository, the Rally index setup includes the "index.requests.cache.enable": false setting to turn off the cache.
However, this setting is part of a Rally indexing track, which is not used for indexing if one follows the instructions in the benchmarking repository. The Rally indexing track also includes a match_only_text type field, which is not a valid OpenSearch type. This further indicates that the indexing track is not used for indexing.
The index settings actually used for indexing are specified in the "datastreams" path of the benchmark repository - here neither the Elasticsearch nor the OpenSearch index settings turn off the shard request cache. This is consistent with what we have seen locally.
Request timing in the Elastic benchmark
The main thing that has me thinking that the Elastic benchmark had caching enabled is however the request timing. Let's explore why.
We don't have the full result dataset from the benchmark done by Elastic (as far as I know) . But we do have some charts from their post. They have one chart labeled "Date Histogram" in this image:
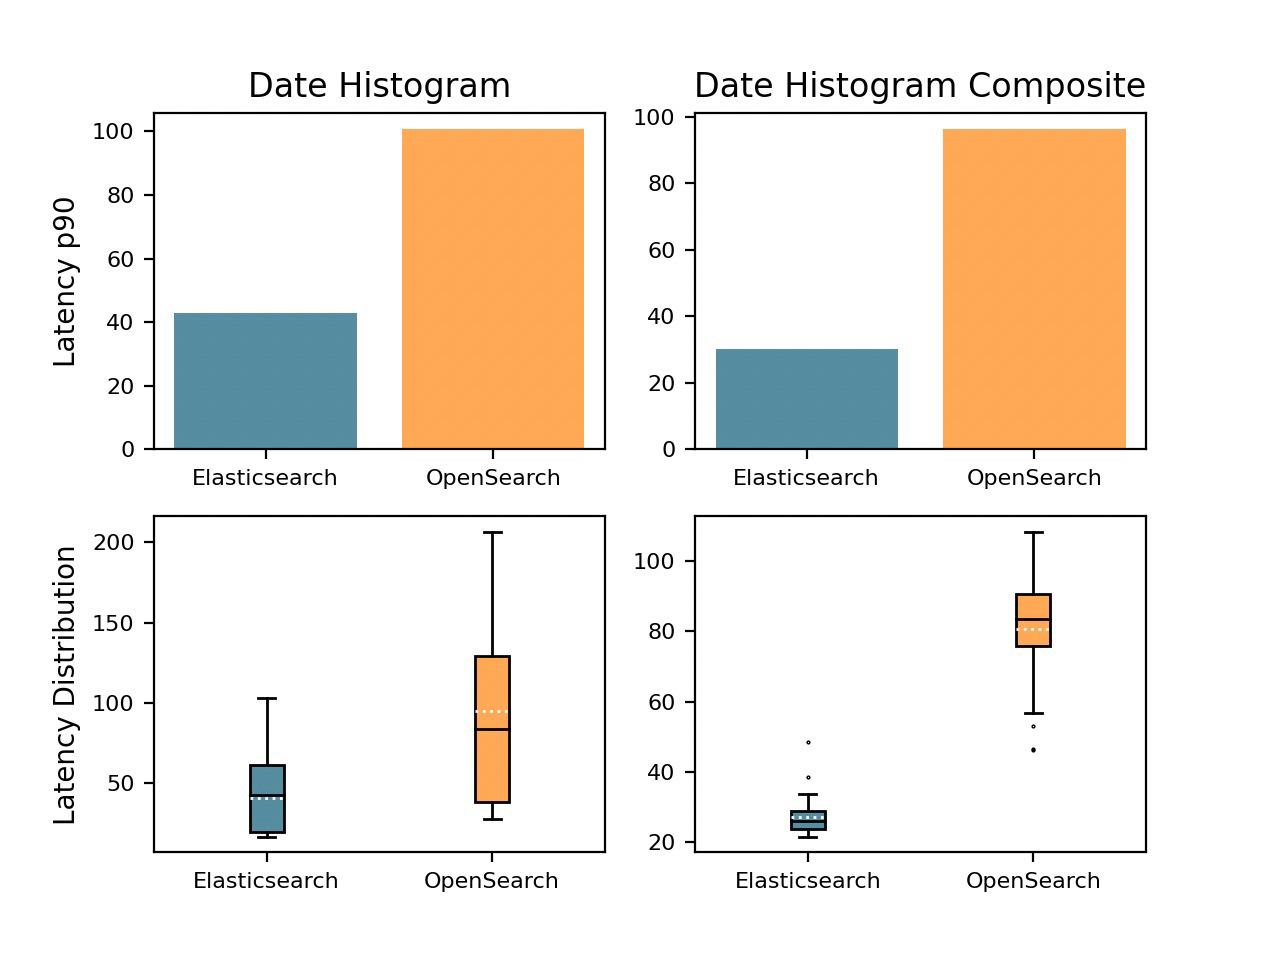
Chart shown in the Elastic blog post.
By reading the charts.py file in the benchmarking repository, we can see that the chart is generated using a combination of the results from the date_histogram_hourly_agg and the date_histogram_minute_agg (I believe that they use the mean of the 90th percentiles). This is why I picked those operations above - we can now compare them.
In my local benchmark of the date histograms, the mean of the 90th percentile response time for Elasticsearch would be 5650 ms without the cache - it would be 3 ms with cache.
Looking at Other Requests
Elastic's post also has a chart showing the term query to have a 90th percentile of ~20ms:
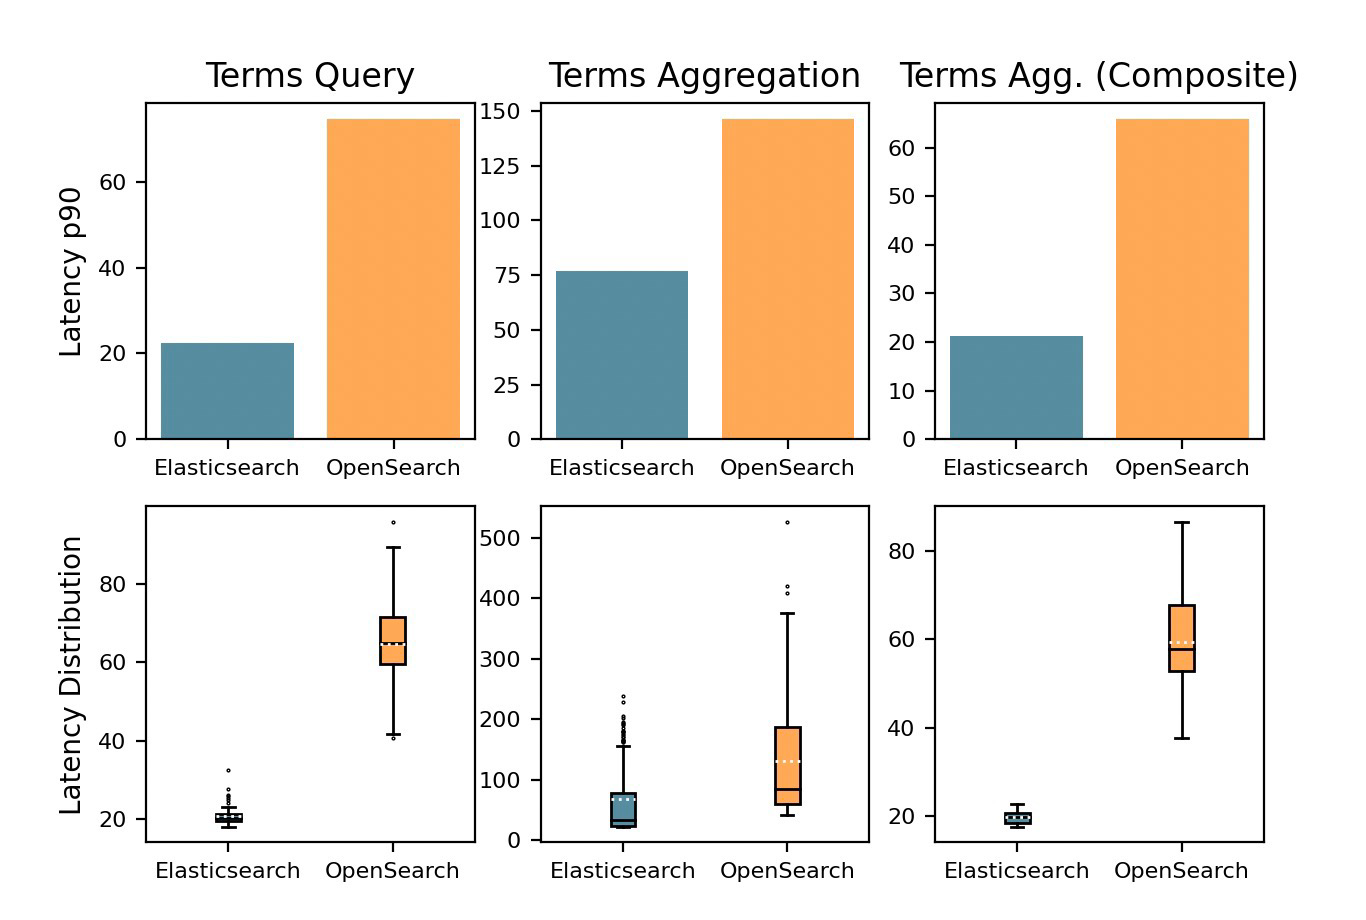
Chart shown in the Elastic blog post.
The "Terms Query" chart is only generated from the term query, making it easy to compare. The term query is not cached. In our local setup the term query had a 90th percentile of 1-2ms depending on if it matched any documents.
We can also look at the sort charts, which are also not cached:
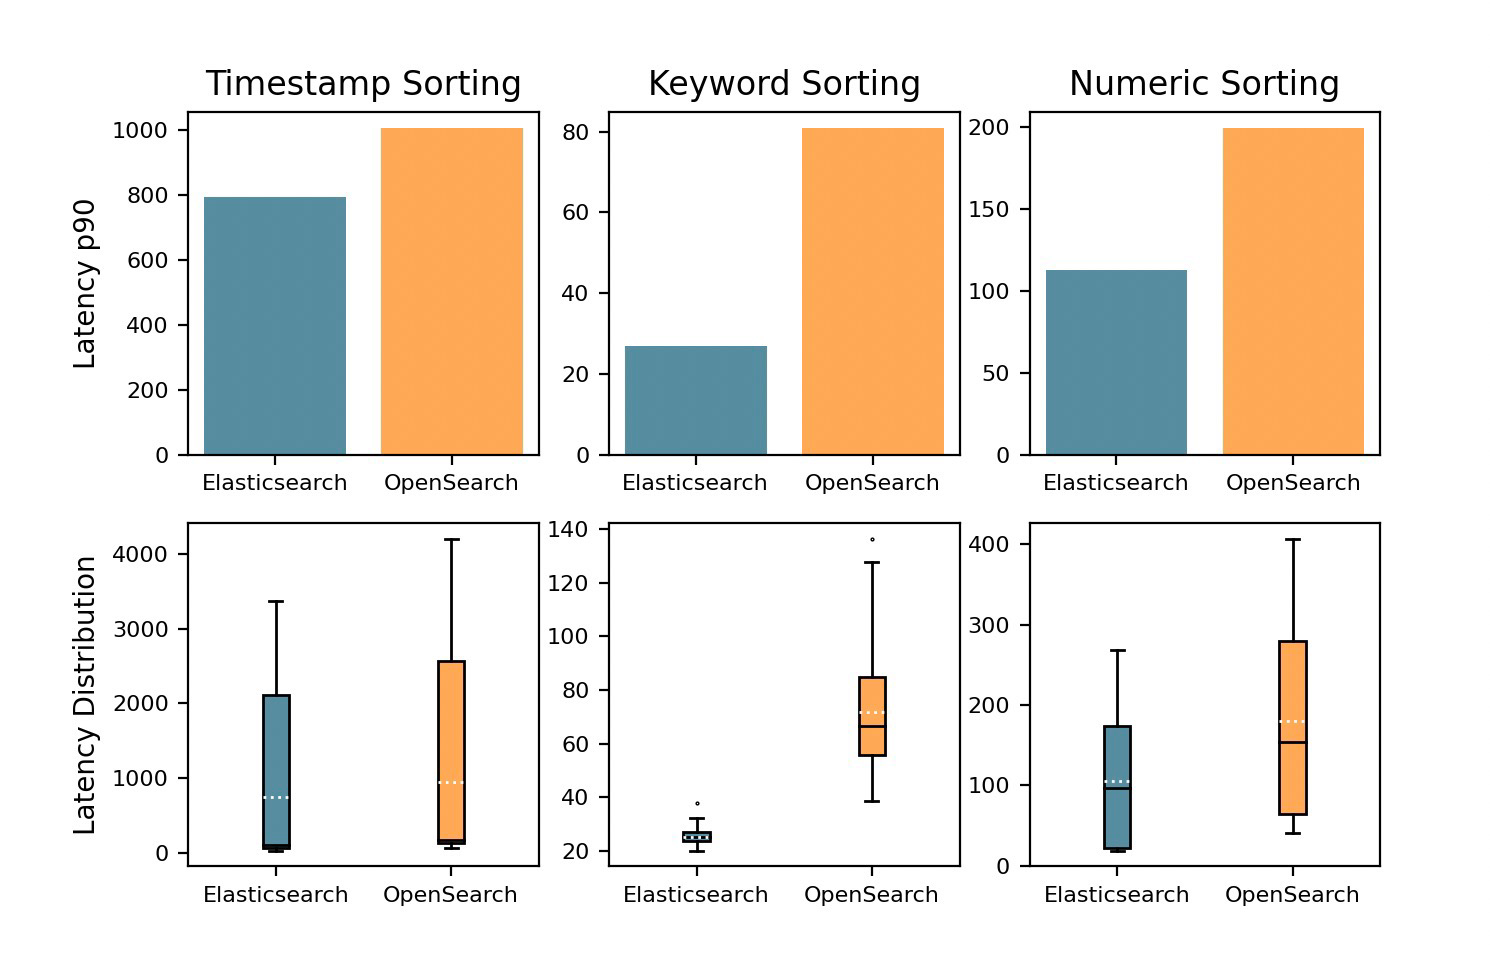
Chart shown in the Elastic blog post.
These charts do suffer a bit from data combination - as evident in that the combined p90 for Timestamp sorting being ~800ms while the latency distribution goes from ~50ms to ~3500 ms. But it looks to behave roughly like sorting does in my local setup.
Did the Elastic Benchmark Have Caching Enabled?
So, if the original benchmark by Elastic did not have caching, it would mean that their Elasticsearch setup executed the histogram requests 141 times faster than my local setup, while my local setup was 10 times faster at term queries and roughly the same speed at sorting. I don't find this believable.
Here I would like to remind you that my local nodes had ~1,7 billion documents - the nodes in the original benchmark should have about ~1.86 billion each (including replicas). We can reason about their relative performance.
I also do not find it believable that building date histogram of billions of documents would have a p90 of 40ms in an Elasticsearch (or OpenSearch) setup where finding the 10 newest documents (by @timestamp ) takes up to 3000 ms (per the sorting charts).
I believe that the shard request cache was left on for the benchmark Elastic's post is based on. Without it, aggregations would have much longer response times. This goes for both the Date Histogram and the Terms aggregations.
Elasticsearch vs OpenSearch in the Elastic blog post
So now, we have concluded that the Date Histogram in benchmark likely only tests the cache. But why did the cached query have a p99 latency of 100ms in OpenSearch, and only 40ms in Elasticsearch? Let's have a look at some of the fastest queries. Again, all numbers are the 90th percentile response time, in milliseconds.
| Operation | term | date_histogram |
|---|---|---|
| ES, locally | 2 ms | 3 ms |
| OS, locally | 2 ms | 5 ms |
| ES, Elastic blog post | 20 ms | 40 ms |
| OS, Elastic blog post | 40 ms | 100 ms |
Locally these are very fast, and as fast in OpenSearch as in Elasticsearch. In the Elastic benchmark setup, there is suddenly a big difference.
I've run all my benchmarks on a single machine with a single node and the same hardware. According to the benchmark repository, the Elastic benchmark used a GCP/Kubernetes setup with 6 nodes with a load balancer and Rally running in a separate pod.
I can think of two main categories why OpenSearch would be so much slower at e.g. term queries than Elasticsearch in the Elastic benchmark setup:
- OpenSearch is somehow much slower at doing multi-node queries than Elasticsearch
- The Elasticsearch machine/networking infra was better than for OpenSearch.
I find the second option more likely. One reason is that the fork is only two years old, I find it unlikely that the network code has changed that much.
Networking and Storage
The bigger reason has to do with that we know almost nothing about the actual network layout of the GCP/k8s setup. Since k8s can choose to put pods on different virtual machines, we don't know where the Rally pod was, and where the Elasticsearch/OpenSearch pods or load balancers were. If I understand things correctly, this also extends to multiple zones - i.e. multiple data centers.
I also have some doubts with regards to the storage setup. I don't fully understand it - but it does seem pretty clear that some kind of network attached storage is used. It seems like they are SSDs, but I haven't been able to figure out from source or docs if they are guaranteed to be in the same zone (data center) as the pod running the Elasticsearch/OpenSearch node. The setup code for this seems to be different for Elasticsearch and OpenSearch.
The Elastic benchmark draws many conclusions of the relative performance of Elasticsearch and OpenSearch based on the ~20-100ms difference in p90 latency for Date Histograms, Terms Aggregations and Terms Queries. All of these requests take less than 10ms (most less than 3ms) in my local setup. To me, it seems likely that the main differentiator in the Elastic blog post is network latency. To make any conclusions, I think that more uncertainties around networking would need to be explained.
Conclusions & Takeaways
Some things make it very hard to reproduce or draw conclusions from the Elastic benchmark:
- Some queries seem to not match any documents, making them faster. This is especially true for range queries.
- I find it very likely that most aggregations were cached in the original benchmark by Elastic, despite it claiming not to use caching.
- In these fast queries, network (or some other external factor) is likely to be the main differentiator between Elasticsearch and OpenSearch.
I don't believe that any conclusion of the relative performance of Elasticsearch and OpenSearch can be drawn from the benchmark done by Elastic. The only possible exception being timestamp sorting, where the response time was large enough to somewhat offset the latency issues.
I would be more inclined to draw conclusions from the original benchmark if it had explored where the differences in Elasticsearch and OpenSearch came from. E.g. if it had proved that the increased latency in OpenSearch was from OpenSearch network code rather than the network setup used in the benchmark.
Final words
I should make clear that I do not believe that the Elastic blog post is intentionally misleading. Generalised benchmarks like this are hard and cumbersome to do. And the latency issues show that the only thing that really matters for you is your setup, your data and your queries. Removing a load balancer could have a larger effect than replacing Elasticsearch with OpenSearch (or vice versa).
If you want help with understanding your setup, or just want to talk about this post, reach out to me at anton@blunders.io.