2020-12-10 - Blunders uses Blunders
The Blunders backend is written in Kotlin. Kotlin runs on the JVM, and of course Blunders is used to profile itself. Dogfooding allows (and forces) me to improve the product, both by learning paint points and by making it faster.
Since Blunders continuously runs in production, I am able to see what code paths end up using the most resources for real requests. For example, I just saw that a large amount of CPU is spent on converting class names for flame charts. And sometimes like 30% of the allocations were in serialising JSON to send to the front-end. What's your code doing in production?
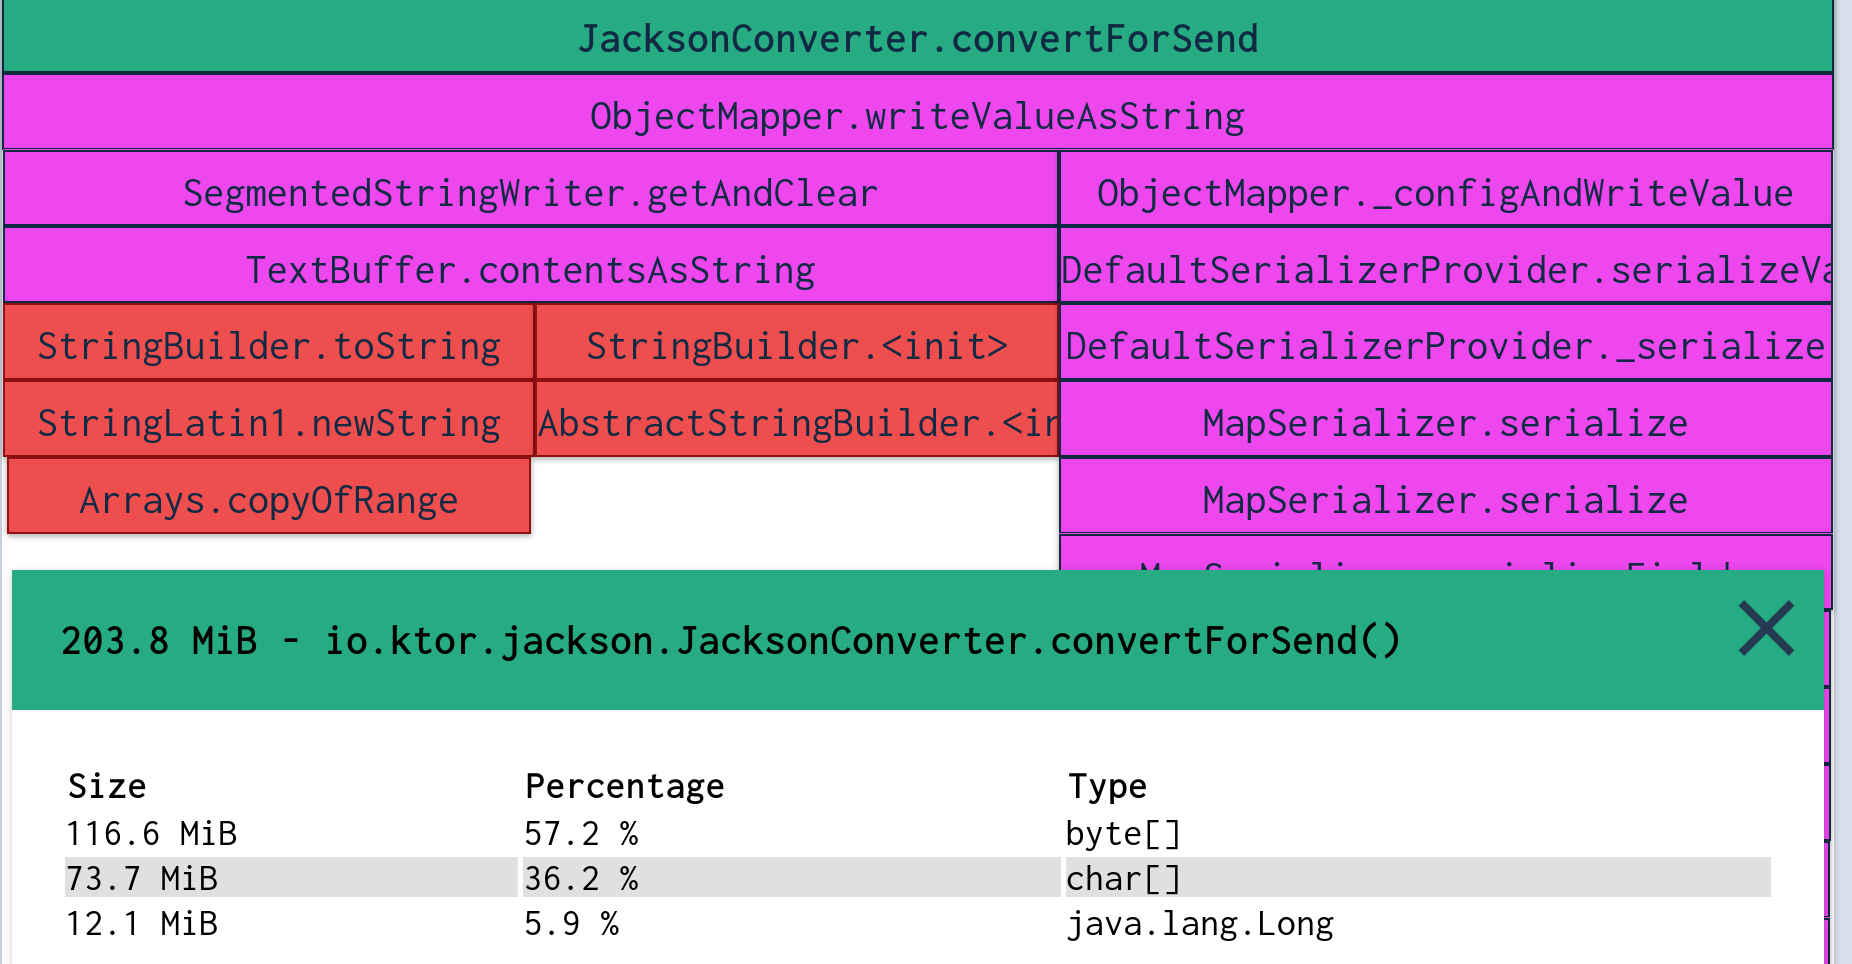
Hello there, Jackson.
I find it quite empowering to know what the production app is doing. I don't always act on it, my time is often better spent elsewhere. But when I want to change stuff, I have a clearer picture in my mind of what the effects will be.
How I improve performance
When I want to spend my time improving performance, I have a very un-exciting way of doing so:
- I generally start by noticing opportunities by looking at what Blunders is doing in production.
- I then sometimes try to reproduce this locally, by running the Blunders webapp locally and hitting it with ab.
- I then try applying some fix to the issue, benchmarking and testing the fix. I profile the fixes using Blunders as well. If the fix was good, great! Otherwise, rinse and repeat.
- Last step is deploying to production. I look at the profiling data from the new code. If it had an unexpected effect in production, I roll back. Or forward, depending on the situation.
The bottlenecks of Blunders
The most performance-sensitive part of Blunders is transforming Java Flight Recorder (JFR) data into visualisation data. For example, to render a chart of the allocation rate per second Blunders parses JFR files, finding all allocation events and sums it up per second. Being performant in this area enables visualization of more data and makes the visualisations snappier.
At the start of Blunders, I simply used the JFR parser built into OpenJDK. This worked, but was not quite fast enough for my use case. I used Blunders to figure out what the issues with the implementation was, and used that to figure out what I could do to get around it.
I ended up Building my own parser for JFR files. It has taken a few generations, and every generation has taught me something. The first few generations relied on the built-in parser, but added in-memory caching. I then went on to a custom implementation of the parser. After a quite a few iterations, it is now quite a bit faster. A big reason is that it allocates nothing on the heap for most events. The custom parser is about 5 times faster without any caching, and about 60 times faster with caches (which are pre-populated).
What I've learnt
Building and using Blunders helps me a great deal in building faster software, and has taught me a lot of things for how to work with performance in practice:
- Speed can enable features.
- The JVM is plenty fast.
- If you allocate less, the Garbage Collector is not a problem
- Profile, profile, profile. Observability wins.
- Always test with real data.
Speeding up Blunders means that I can offer users faster data visualisations of more profiling data. This makes it easier for them to make informed decisions about how to work with performance in their applications.